Post-election Reflection
It has now been almost two weeks since Donald Trump won the 2024 election, thus the time has come to evaluate my prediction model and attempt to understand where I fell short. To begin, here is another look at my prediction:
My 2024 Prediction Model
My prediction model utilized an elastic-net regularized regression of four key predictor variables: the interaction effect between Q2 GDP growth and incumbency, the latest FiveThirtyEight weighted poll averages, two-party voteshare lagged one cycle, and two-party vote share lagged two cycles. In choosing these variables I hoped to build a relatively simple model which could apply to an election as unusual as this one. For a full explanation of each variable as well as my justification for its inclusion, refer to my week nine blog post linked here.
I utilized an elastic-net regularized regression to control for multicollinearity and overfitting while maintaining my model’s simplicity, transparency, and generalizability. Once again, my week nine blog post provides a more in-depth explaination for my choice of model.
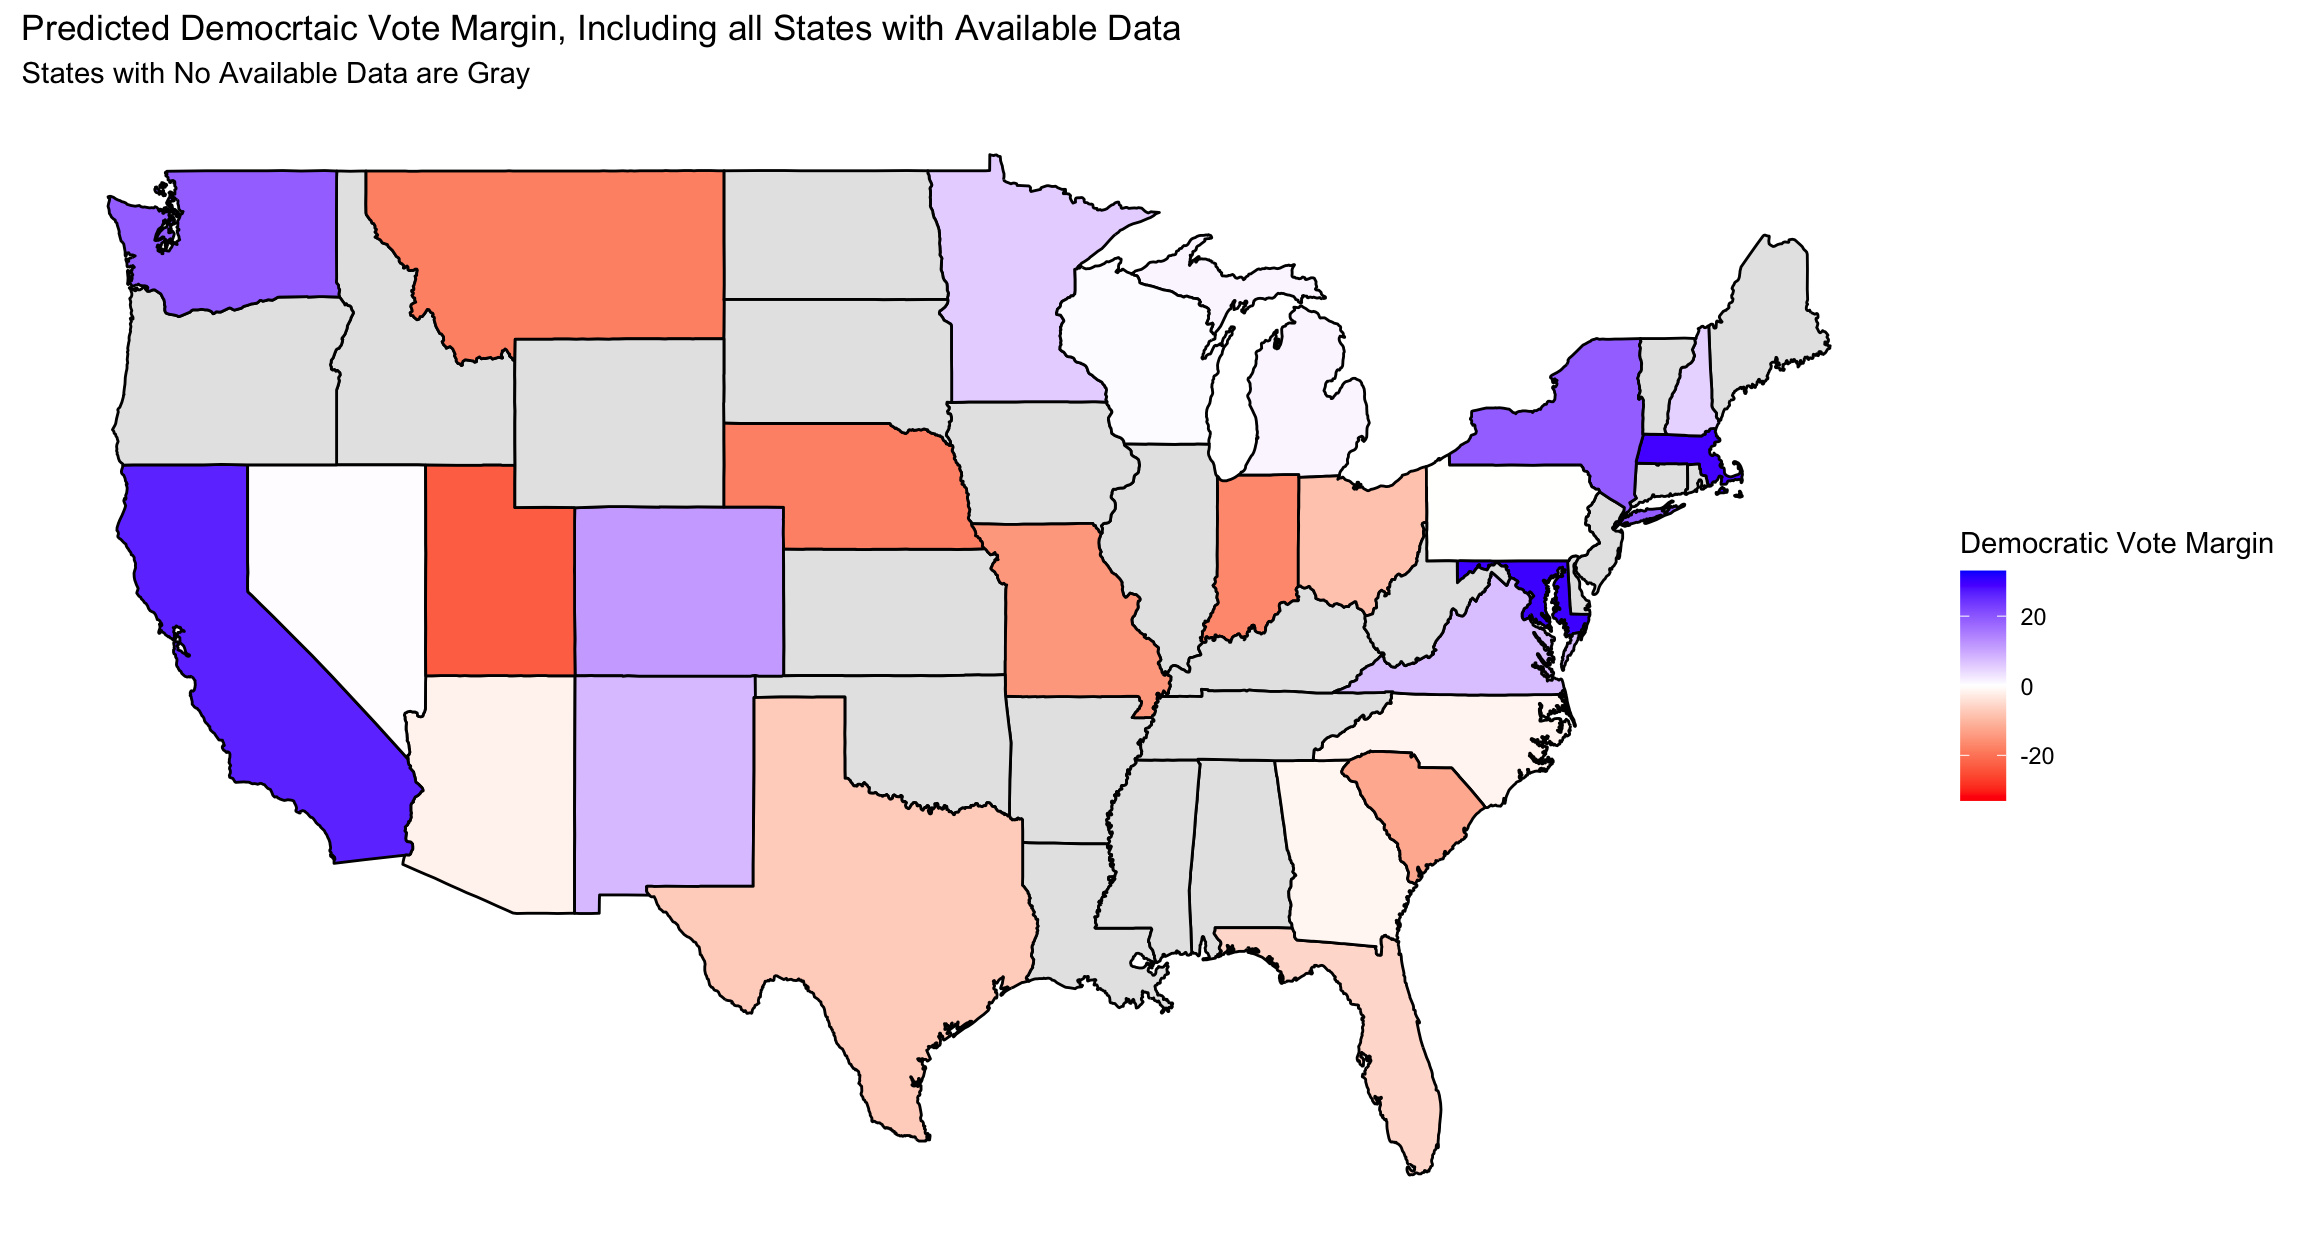
Finally, since my two-party vote share summed to over 100%, I normalized my predictions for both Democratic and Republican two-party vote share against each other. My results are summarized below:
| State | Democratic Prediction | Republican Prediction | Winner |
|---|---|---|---|
| Arizona | 49.01264 | 50.98736 | Trump |
| California | 63.23344 | 36.76656 | Harris |
| Colorado | 55.64653 | 44.35347 | Harris |
| Florida | 47.18219 | 52.81781 | Trump |
| Georgia | 49.32191 | 50.67809 | Trump |
| Indiana | 41.54380 | 58.45620 | Trump |
| Maryland | 64.87031 | 35.12969 | Harris |
| Massachusetts | 64.61116 | 35.38884 | Harris |
| Michigan | 50.52614 | 49.47386 | Harris |
| Minnesota | 52.82845 | 47.17155 | Harris |
| Missouri | 42.63210 | 57.36790 | Trump |
| Montana | 40.92078 | 59.07922 | Trump |
| Nebraska | 40.98905 | 59.01095 | Trump |
| Nevada | 50.10748 | 49.89252 | Harris |
| New Hampshire | 52.52822 | 47.47178 | Harris |
| New Mexico | 53.92110 | 46.07890 | Harris |
| New York | 59.57050 | 40.42950 | Harris |
| North Carolina | 49.18136 | 50.81864 | Trump |
| Ohio | 45.70131 | 54.29869 | Trump |
| Pennsylvania | 49.96810 | 50.03190 | Trump |
| South Carolina | 43.84510 | 56.15490 | Trump |
| Texas | 46.29662 | 53.70338 | Trump |
| Utah | 38.53670 | 61.46330 | Trump |
| Virginia | 53.59095 | 46.40905 | Harris |
| Washington | 59.57236 | 40.42764 | Harris |
| Wisconsin | 50.20683 | 49.79317 | Harris |
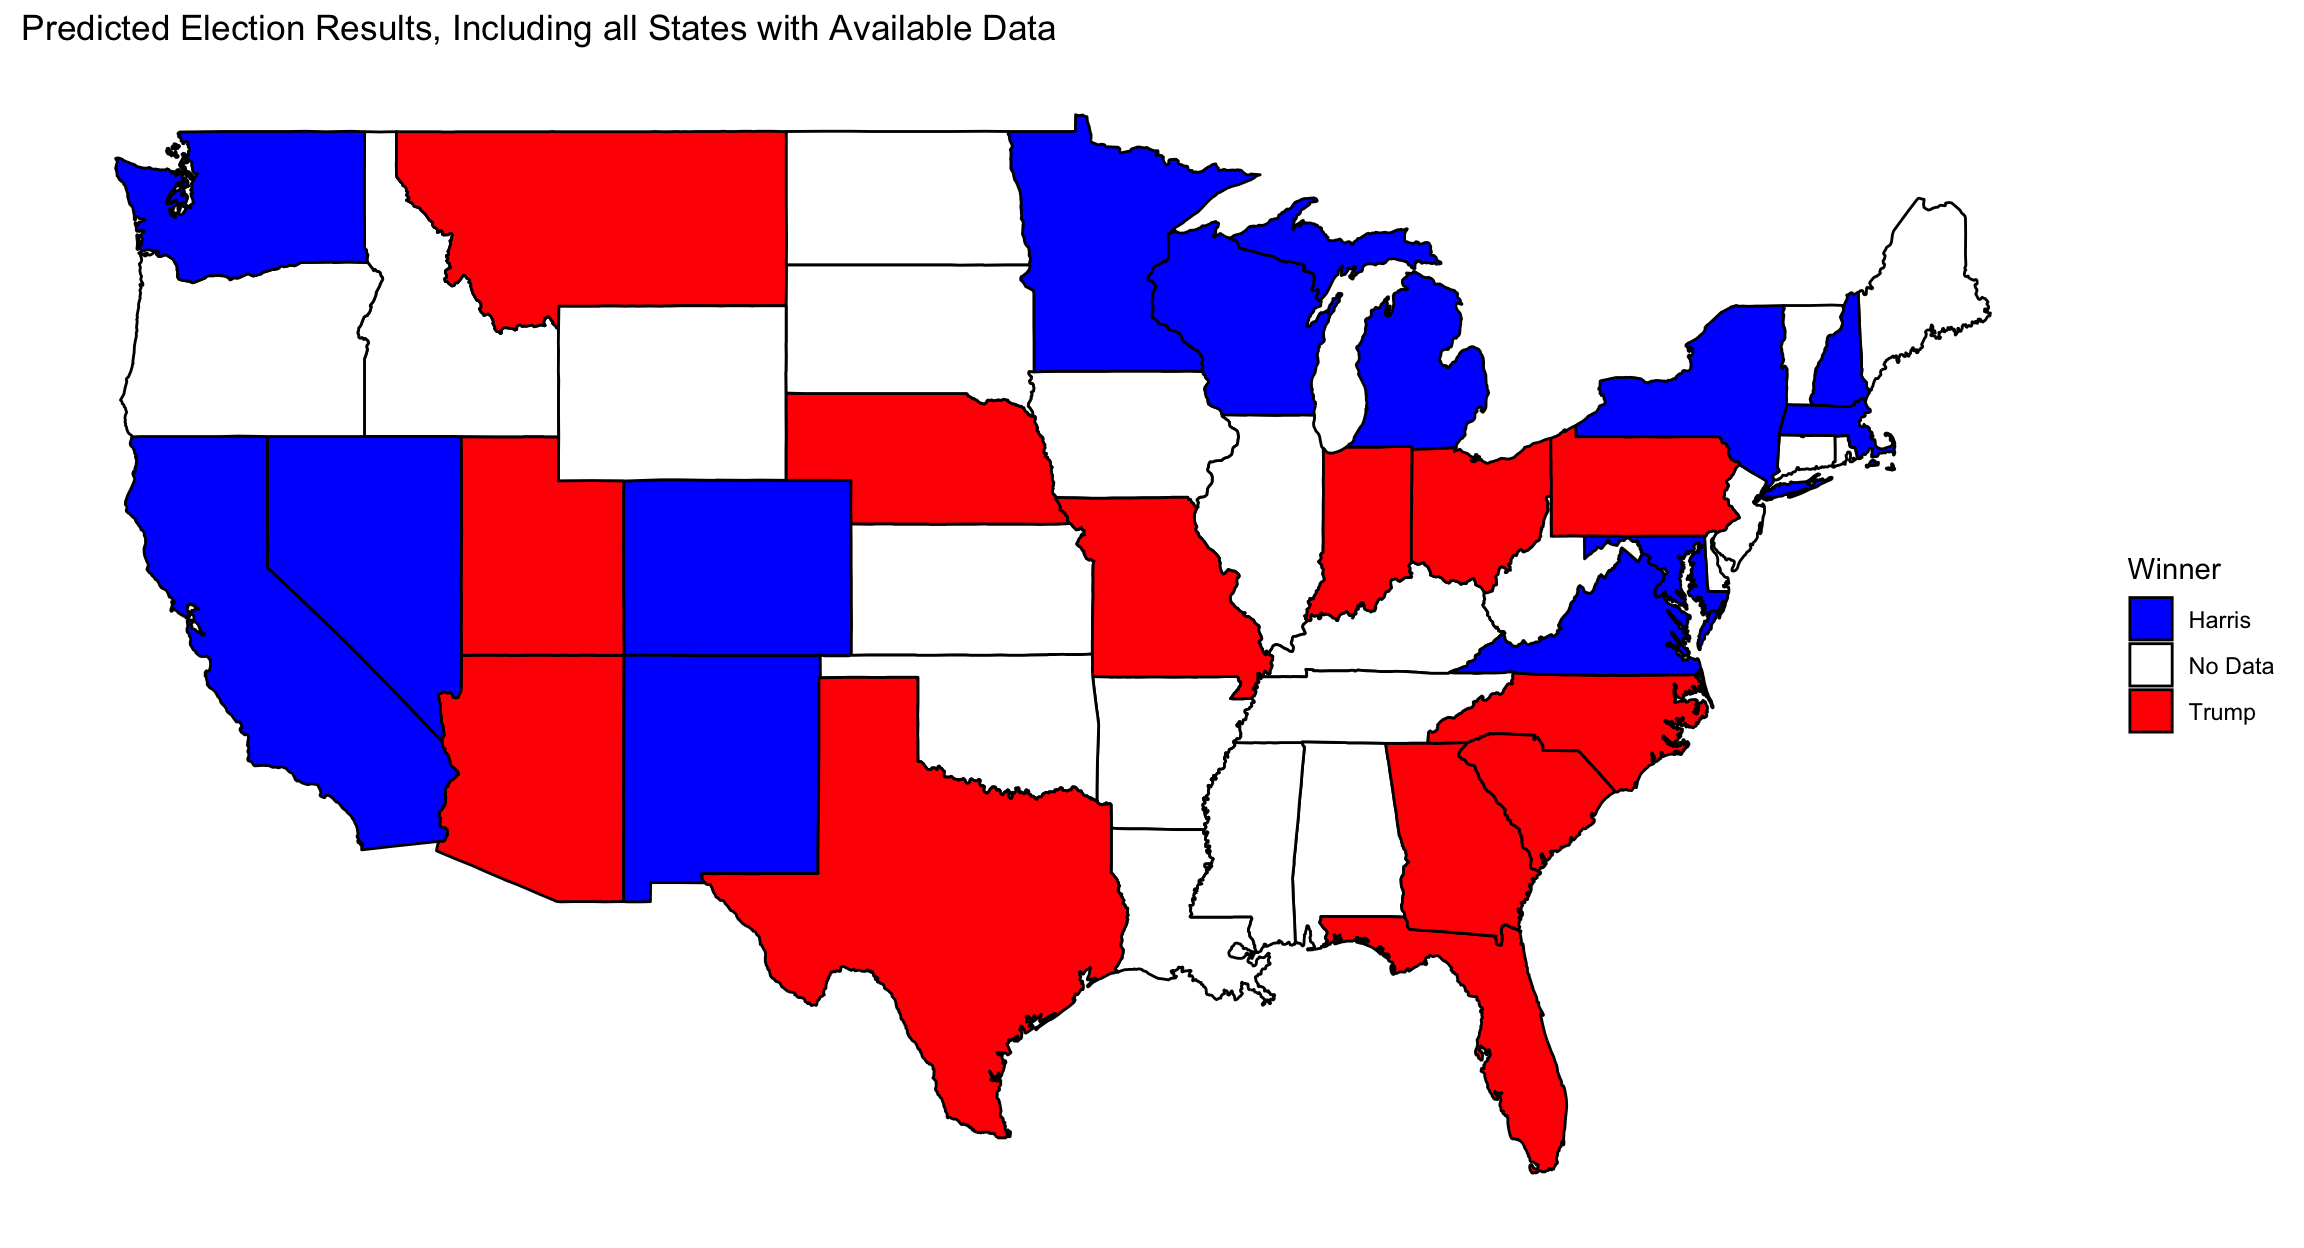
My model predicted that Harris would win Michigan, Nevada, and Wisconsin on a slim margin, while Trump would have won Arizona, Pennsylvania, Georgia, and North Carolina on similarly slim margin. This would have resulted in a Trump victory with 281 electors while Harris had 257 electors.
The 2024 Election Results
Early Wednesday morning the 2024 election was called for Former President Donald Trump after he managed to clinch Georgia, North Carolina, and Pennsylvania. In the hours that followed, the rest of the swing states — Michigan, Wisconsin, Arizona, and Nevada — were called for Donald Trump as well. This means that Trump won the election with 312 electoral votes compared to Vice President Harris’ 226 electoral votes.
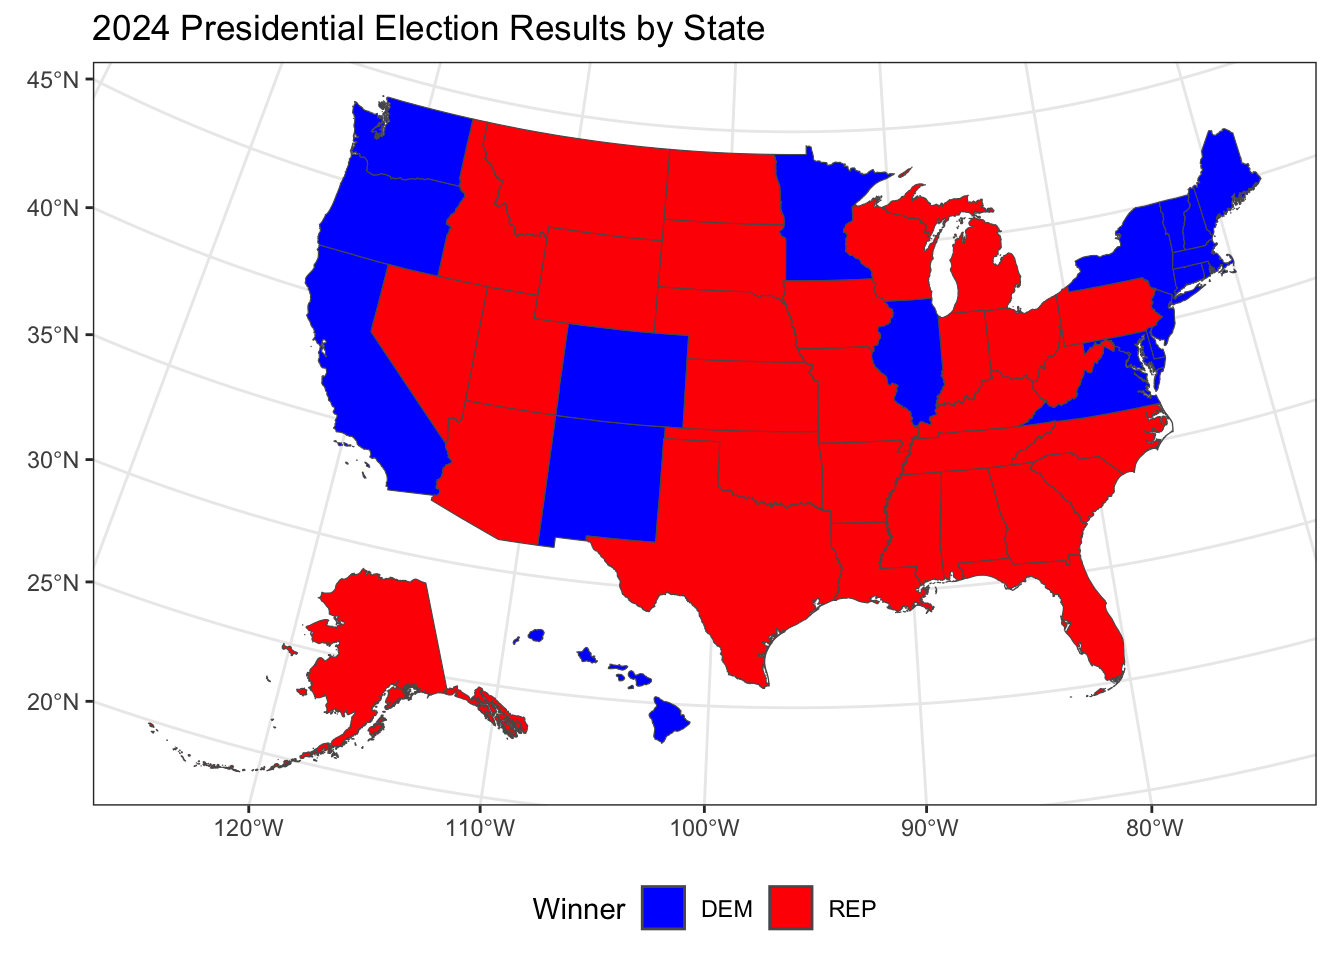
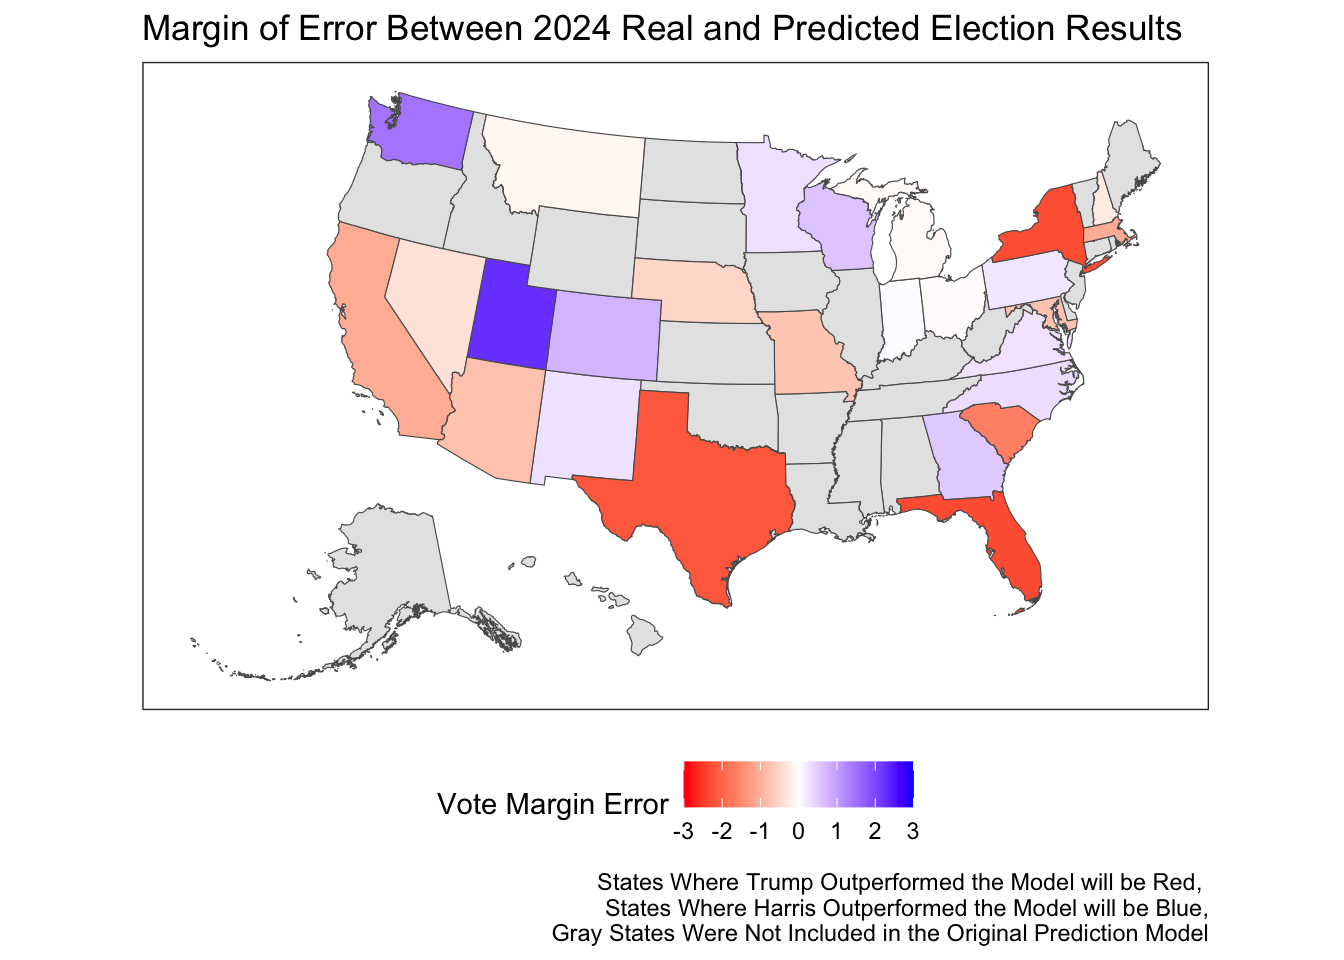
The overwhelming shift toward Donald Trump and the Republican party was seen across the United States, as is outlined in the map included below:

Comparing My Predictions with the Actual Results
I predicted that Trump would narrowly beat Harris with 281 electoral votes by winning Georgia, North Carolina, and Pennsylvania by incredibly slim margins. Instead, Trump managed to win every one of the seven swing states. The table below compares my predicted vote margins with the reality in each swing state.
| State | 2024 Republican Vote Share | Republican Prediction | 2024 Democratic Vote Share | Democratic Prediction | Winner |
|---|---|---|---|---|---|
| georgia | 51.12155 | 50.67809 | 48.87845 | 49.32191 | Trump |
| pennsylvania | 51.01765 | 50.03190 | 48.98235 | 49.96810 | Trump |
| nevada | 51.62171 | 49.89252 | 48.37829 | 50.10748 | Trump |
| michigan | 50.69844 | 49.47386 | 49.30156 | 50.52614 | Trump |
| arizona | 52.84747 | 50.98736 | 47.15253 | 49.01264 | Trump |
| wisconsin | 50.46844 | 49.79317 | 49.53156 | 50.20683 | Trump |
| north carolina | 51.70111 | 50.81864 | 48.29889 | 49.18136 | Trump |
To better understand the magnitude and direction of this error, I have outlined my model’s prediction error clearly in this table:
| State | 2024 Democratic Vote Share | Democratic Prediction | Democratic Vote Share Error |
|---|---|---|---|
| georgia | 48.87845 | 49.32191 | -0.4434620 |
| pennsylvania | 48.98235 | 49.96810 | -0.9857550 |
| nevada | 48.37829 | 50.10748 | -1.7291875 |
| michigan | 49.30156 | 50.52614 | -1.2245852 |
| arizona | 47.15253 | 49.01264 | -1.8601160 |
| wisconsin | 49.53156 | 50.20683 | -0.6752730 |
| north carolina | 48.29889 | 49.18136 | -0.8824625 |
As the tables above indicate, my model overpredicted for Harris in every swing state.
Georgia: My model correctly predicted that Georgia would swing for Trump. Furthermore, the margin of error between my prediction model and the actual result was only 0.44 percentage points: a relatively small under prediction for Trump. My working hypothesis as to why my model was more accurate in Georgia is that polls in Georgia have been incredibly accurate in the Trump era, especially compared to polling in other states. According to FiveThirtyEight, Georgia’s average polling miss across 188 polls since 2016 was only 3.4 points (FiveThirtyEight, 2024). I believe this enhanced accuracy in accounting for the Trump-effect increased the accuracy of Georgia’s prediction.
Arizona: My model also asserted that Arizona would vote for Trump. This state, however, saw the largest margin of error wherein my model overpredicted Harris’s performance by a margin of 1.86 points. This result calls into question my earlier hypothesis as FiveThirtyEight asserts that Arizona’s average polling miss across 162 polls since 2016 was 3.7 points, only 0.3 points higher than Georgia (FiveThirtyEight, 2024).
North Carolina: I accurately predicted that North Carolina would swing for Trump. The margin for error in this prediction was 0.88 percentage points, placing it on the smaller end in terms of magnitude. My prediction is that the North Carolina model was more accurate as North Carolina is the only state of that seven that has swung for former President Trump in both 2016 and 2020, thus the lagged vote share may predict a Trump victory more accurately.
Pennsylvania: Pennsylvania is the most interesting state in my prediction model as I had originally predicted it would swing for Harris when using the latest FiveThirtyEight poll averages taken about three weeks before election day. When I updated my poll averages the day before the election, however, Pennsylvania flipped for Trump on a narrow margin of 0.003 percentage points. This prediction ended up being correct, though it still overpredicted Harris’s vote share by 0.99 percentage points. Three weeks before election day, FiveThirtyEight’s latest aggregate poll showed Harris above Trump with a margin of 0.7 percentage points (FineThirtyEight, 2024). In the data I used for my model, Trump had shifted to having a 0.2 percentage point margin above Harris. This 0.9 point shift in the polls led Pennsylvania to swing for a different candidate, thus indicating how important poll accuracy was for the success of my model.
Michigan: Michigan was one of the three states that I incorrectly predicted would swing for Harris. My model had overpredicted Harris’s vote margin by 1.22 percentage points. My hypothesis is that both Michigan and Wisconsin were biased by polling data which overpredicted Harris’s vote margin as Michigan and Wisconsin were thought of as part of the “Blue Wall.” Blue Wall states are those which have voted for a Democratic candidate from 1992 to 2012 and again in 2020, with the one exception being Trump’s election in 2016. According to FiveThirtyEight, Michigan’s average polling miss across 133 polls since 2016 was 5.4 points (FiveThirtyEight, 2024). Furthermore, Michigan polling from FiveThirtyEight had Harris at a 0.9 percentage point margin above Trump.
Wisconsin: Like Michigan, my model also incorrectly predicted a Harris victory in Wisconsin. The prediction error in Wisconsin was around 0.67 percentage points, so around half of the error in Michigan. I am unsure why my model was more accurate in Wisconsin than in Michigan, especially because Wisconsin’s average polling miss across 81 polls since 2016 was 5.6 points (FiveThirtyEight, 2024).
Nevada: Finally, my last incorrect prediction was in Nevada where I overpredicted Harris’s margin by 1.73 percentage points. Nevada had voted for the Democratic candidate in 2016 and 2020, thus the lagged vote share most likely biased my model. Indeed, Nevada’s polls are thought of as the most accurate — the state’s average polling miss across 86 polls since 2016 was 3.3 points (FiveThirtyEight, 2024). I am unsure as to why Nevada would have behaved differently in this election and will explore that (and my other hypotheses) in depth below.
Calculating My Model’s Error
To better understand the error in my prediction model, I will utilize both graphics and calculations of bias and error.
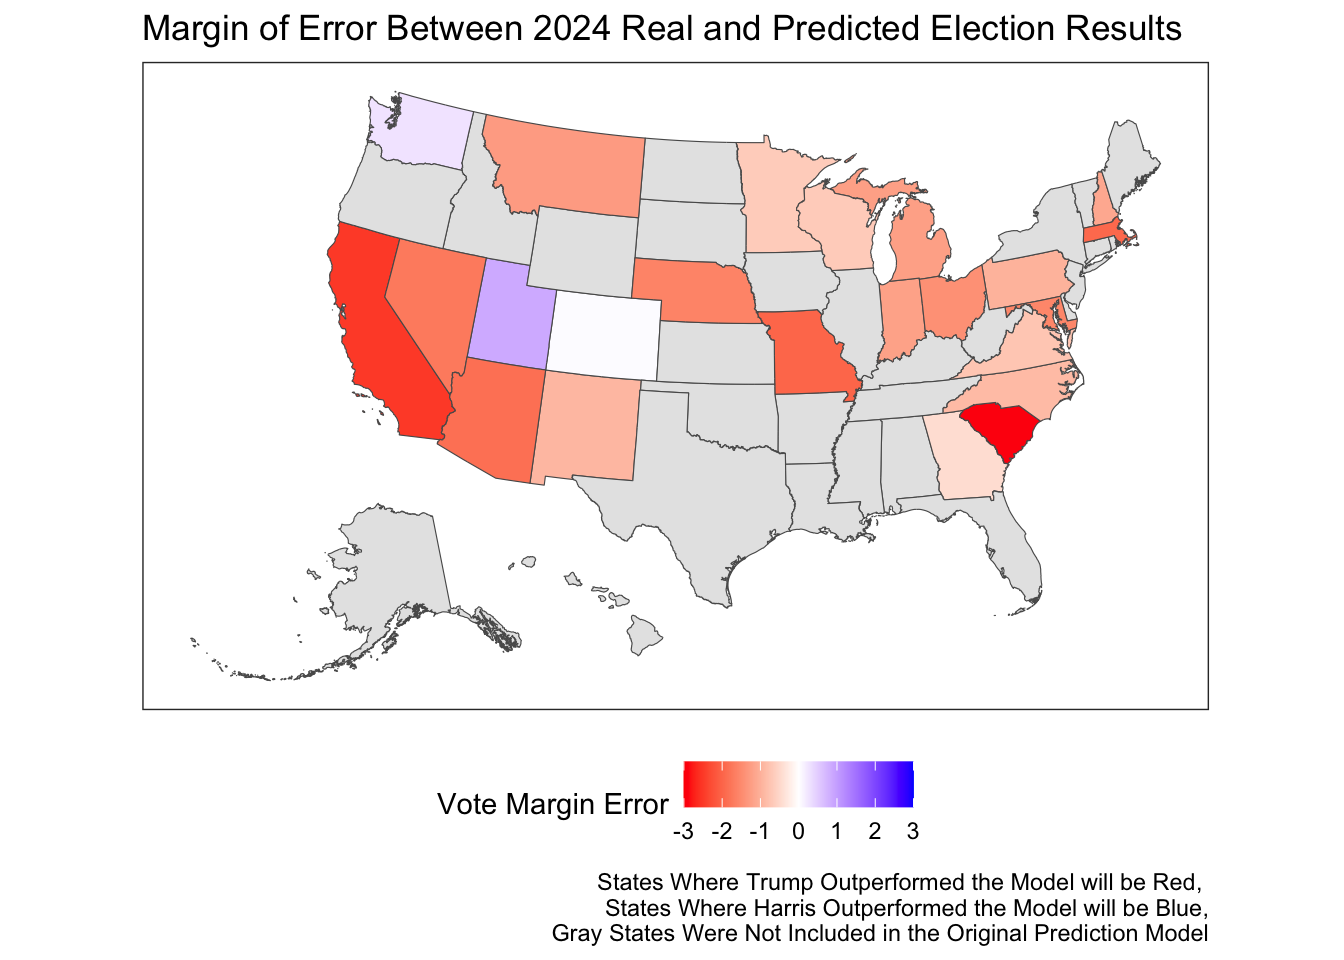
The graphic above indicates that for every state except Washington, Utah, and Colorado, Trump outperformed the model. This indicates systemic model bias in favor of Harris which I will attempt to understand and explore below.
| Metric | Value |
|---|---|
| Bias | -1.4362 |
| Mean Squared Error (MSE) | 3.3204 |
| Root Mean Squared Error (RMSE) | 1.8222 |
- Bias: Numerically, my model was biased to overpredict Harris’s vote share by an average of 1.44 percentage points. This is curious as when calculating the mean error of my final prediction model using out-of-sample cross-validation I had calculated that the mean error for Democrats is around -0.25, indicating my model tended to slightly underestimate Democrat performance. This systematic overestimation of Harris’s performance is unique to this election cycle and an undesirable outcome of my model. I will attempt to understand what happened below.
- Mean Squared Error: The average squared error is 3.32. This value is sensitive to larger errors because squaring amplifies the impact of larger deviations. This value is difficult to interpret in the context of vote margin since it is squared; however, I use it here to compare it to the square of the mean out-of-sample error of my model calculated using cross-validation. The mean error for a Democratic prediction prior to 2024 was -0.25 making the mean squared error 0.0625. Indeed, the mean squared error of my 2024 prediction is nearly 54 times that of my model prior to 2024.
- Root Mean Squared Error: To interpret this error in terms of vote percentage, root mean squared error was calculated to be 1.82. This means that my model was, on average, 1.82 percentage points off from the actual Democratic vote share.
Correcting my Model to be Fully Saturated
After completing my prediction model, I realized that when including the interaction effect between Q2 GDP growth and incumbency, it is essential to also include the individual variables (Q2 GDP growth and incumbency) to ensure that the model is fully saturated. A fully saturated model accounts for the main effects of each variable alongside their interaction, which is a standard practice in data science to avoid omitting key predictors. I have decided to address this oversight by updating my model and re-evaluating its errors. This will ensure that any hypotheses I make regarding the model’s inaccuracies are based on a version of the model that adheres to proper data science principles and standards.
| State | Democratic Prediction | Republican Prediction | Winner |
|---|---|---|---|
| Arizona | 47.93258 | 52.06742 | Trump |
| Georgia | 48.32418 | 51.67582 | Trump |
| Michigan | 49.37494 | 50.62506 | Trump |
| Nevada | 48.76123 | 51.23877 | Trump |
| North Carolina | 47.95686 | 52.04314 | Trump |
| Pennsylvania | 48.74113 | 51.25887 | Trump |
| Wisconsin | 48.92938 | 51.07062 | Trump |
As is displayed above, had I correctly included Q2 GDP Growth, Incumbency, and the interaction effect between them in a fully saturated version of my model I would have accurately predicted a Trump victory in all seven swing states.
Re-Calculating Model Error
To evaluate the performance of this adjusted model I will one again run through the steps I took above when initially evaluating my model. First, I have included a comparison of my predictions and the actual 2024 election results.
| State | 2024 Republican Vote Share | Republican Prediction | 2024 Democratic Vote Share | Democratic Prediction | Winner |
|---|---|---|---|---|---|
| Georgia | 51.12155 | 51.67582 | 48.87845 | 48.32418 | Trump |
| Pennsylvania | 51.01765 | 51.25887 | 48.98235 | 48.74113 | Trump |
| Nevada | 51.62171 | 51.23877 | 48.37829 | 48.76123 | Trump |
| Michigan | 50.69844 | 50.62506 | 49.30156 | 49.37494 | Trump |
| Arizona | 52.84747 | 52.06742 | 47.15253 | 47.93258 | Trump |
| Wisconsin | 50.46844 | 51.07062 | 49.53156 | 48.92938 | Trump |
| North Carolina | 51.70111 | 52.04314 | 48.29889 | 47.95686 | Trump |
To better understand the magnitude and direction of this error, I have outlined my model’s prediction error clearly in this table:
| State | 2024 Democratic Vote Share | Democratic Prediction | Democratic Vote Share Error |
|---|---|---|---|
| Georgia | 48.87845 | 48.32418 | 0.5542656 |
| Pennsylvania | 48.98235 | 48.74113 | 0.2412200 |
| Nevada | 48.37829 | 48.76123 | -0.3829450 |
| Michigan | 49.30156 | 49.37494 | -0.0733865 |
| Arizona | 47.15253 | 47.93258 | -0.7800495 |
| Wisconsin | 49.53156 | 48.92938 | 0.6021822 |
| North Carolina | 48.29889 | 47.95686 | 0.3420382 |
The corrected version of my model accurately predicted a Trump landslide in each of the swing states with the error in democratic vote share equal to less than a percentage point. To visually represent my model’s bias for each state, I plotted them on a map similar to the one pictured above.
As can be seen in the map above, my model does not appear to be biased in either direction as around half of the predicted states were bias toward Trump and the other half were biased toward Harris. This is very different than my less-saturated model above which systematically underpredicted for Trump. Furthermore, the lighter shades of both colors represents the model’s enhanced accuracy in predicting the actual Democratic two-party vote share in each state.
To better understand the bias and error of this adjusted model mathematically, I conducted the same calculations as above on the fully-saturated version of my model here:
| Metric | Value |
|---|---|
| Bias | -0.2736 |
| Mean Squared Error (MSE) | 1.2188 |
| Root Mean Squared Error (RMSE) | 1.1040 |
- Bias: Numerically, my corrected model was biased to overpredict Harris’s vote share by an average of 0.27 percentage points. As is indicated by the different directions of error in each of my swing state predictions, this model does not have the systematic bias towards Harris that the less-saturated version of my model did. I will, however, continue to explore why this version of my model still slightly overpredicts for Harris.
- Mean Squared Error: The average squared error for my corrected model is 1.21 which is over 2 points less than that of my less-saturated model presented above. This implies that a fully saturated version of my model more accurately predicted the actual 2024 vote share.
- Root Mean Squared Error: To interpret this error in terms of vote percentage, root mean squared error was calculated to be 1.1. This means that my model was, on average, 1.1 percentage points off from the actual Democratic vote share. This is 0.7 percentage points lower than the error of my less-saturated model.
Understanding Why My Corrected Model Succeeded (and Why it Failed)
Directly after the election, scholars, journalists, forecasters, and politicians scrambled to make sense of Trump’s overwhelming success in what was thought of to be an incredibly close election. I will now attempt to understand why my initial model fell short of accurately predicting the results, why I believe my corrected model had more success in accurately predicting the results, and how my model’s accuracy could be improved in the future.
Why did my Initial Model Fail?
As I mentioned previously, my initial model fell short of accurately predicting the results of the 2024 election because it was not fully saturated. While I included the interaction effect between Q2 GDP growth and incumbency, I failed to include these two variables independently as part of the model. This omission is problematic because, without the individual terms for Q2 GDP growth and incumbency, the interaction effect cannot be properly interpreted. By excluding these base variables, my model lacked the saturation needed to accurately capture the unique influence of the interaction effect on the predictions. This inevitably distorted the relationships between my variables and ultimately contributed to inaccuracies in my results.
This error stemmed partly from a lack of understanding, but I also have to admit that my decision to code Q2 GDP growth and incumbency solely as an interaction effect was influenced by the model’s initial predictions. When I included both variables independently, the model predicted a landslide victory for Donald Trump—a result that I found difficult to reconcile with my personal expectations and assumptions. In an effort to make the model’s predictions align more closely with what I believed to be plausible, I restructured it to focus on the interaction effect alone. This adjustment produced results where Harris won key states like Michigan, Wisconsin, and Nevada—an outcome I found easier to accept. In hindsight, this decision compromised the model’s integrity, as it prioritized aligning with my beliefs over adhering to principles of data science which I claimed to be committed to.
I believe that this is a learning opportunity for me as I move forward in the field of data science and forecasting. Remaining unbiased is incredibly difficult; however, without understanding and removing my personal bias, I may end up ruining what would have been an accurate prediction.
Why was my Fully Saturated Model so Accurate?
Predictive Variables: When deciding on which variables I wanted to include in my final model, I relied heavily on three understandings —
- Elections are often determined based on fundamental variables, of which the interaction between incumbency and Q2 GDP growth is often the most obvious economic trend to which voters hold an incumbent accountable (Blog Post 2).
- Polls right before the election are most accurate way to take the temperature of the American electorate. Given that my final prediction was to be made the day before election day, I assumed that focusing most intensely on the latest poll averages would allow the model to successfully include an understanding of how Americans felt immediately before the election (Blog Post 3).
- Donald Trump’s impact on American politics has been so unprecedented and volatile that, for the past two election cycles, it has repeatedly confounded pollsters, forecasters, and political scientists. Traditional models often seem unable to fully capture the psychology and motivations of Trump voters, leading to a consistent underprediction and underpolling of his support across the United States. In the context of my predictive election model, I believe that including lagged vote share—which, for the 2024 election, incorporates data from the 2016 and 2020 elections—offers a way to partially account for this effect. By reflecting historical patterns of voter behavior, particularly the surge in support Trump garnered in those years, lagged vote share provides an important anchor in history.
By focusing on a few, carefully chosen variables—each supported by a clear theoretical rationale—I reduced the risk of overfitting and avoided unnecessary complexity. This approach allowed the model to focus on the most critical factors while maintaining a degree of generalizability across states and election cycles. Additionally, the integration of variables like incumbency, GDP growth, and lagged vote share offered a layered understanding of voter behavior, blending long-term trends with immediate dynamics.
Procedure: I believe my model’s accuracy in predicting the 2024 results lies in its simplicity, transparency, and reliance on fundamental variables. By using a regularized regression model instead of more complex ensemble or machine learning methods, I minimized opportunities for model bias and ensured that my predictions were directly interpretable and grounded in clear assumptions. The simplicity of this approach not only reduced overfitting but also enhanced transparency and generalizability, making the model accessible to broader audiences and its predictions robust despite limited data. In an era of skepticism about election integrity, this straightforward approach underscores the importance of transparency and interpretability in fostering public confidence in election forecasts.
How Can I Improve my Model for the Future?
1. Harris Specific Bias: One of my primary assumptions when creating my model was that Harris was a fundamentally different candidate than Biden. Based on this assumption, I specifically excluded Biden’s presidential approval ratings and aggregate polling data from when Biden was the candidate. Furthermore, I avoided over-including economic fundamental interaction effects, which I believed were more attributable to Biden’s presidency than to Harris’s candidacy.
However, in the aftermath of the election, I have come to realize that many voters in the American electorate cast their votes as a referendum on the Biden administration and the Democratic Party as a whole. This dissatisfaction, particularly with Biden’s handling of key issues, appears to have influenced voter decisions in ways that my model failed to account for (New York Times, 2024). My model did not sufficiently incorporate variables that could capture how dissatisfaction with a sitting president shapes voting behavior, such as June presidential approval ratings or economic indicators that voters might attribute to Biden’s policies. This led to a blind spot in understanding how incumbency effects—typically driven by voter perceptions of the incumbent administration—would influence the election results.
Were I to revise this model, I would prioritize including June presidential approval ratings as well as key economic indicators like inflation, wage growth, and unemployment. These variables could help capture voter dissatisfaction with the incumbent administration and better account for the complex role of incumbency and presidential approval in shaping election outcomes.
2. Polling: After three consecutive Trump elections, scholars can now confidently conclude that Trump underpolls. As the Brookings institute concluded days after the election, “today’s polling instruments and techniques are not well designed to measure the kinds of voters for which Trump has a distinctive appeal” (Brookings, 2024). While I am not a pollster and, thus, cannot fix these biases for the sake of my forecast, I believe there are two solutions so as to account for this bias.
First, in my model I utilized FiveThirtyEight’s weighted poll averages. FiveThirtyEight allocates weights based on the historical credibility and accuracy of each pollster, thus attempting to exclude biased and untrustworthy polls. While this is important in theory, in this past election forecasters like Real Clear Politics, who do not weight their polls, performed better (Real Clear Politics, 2024). I hypothesize that by heavily relying on FiveThirtyEight’s weighted averages, my model may have unintentionally incorporated some of the biases introduced by poll herding, ultimately narrowing the scope of information used to predict voter sentiment. To better understand and, if needed, ultimately correct this bias, I would have liked to test a model using the raw latest poll averages. Unfortunately, this data is not readily available so I cannot perform that test.
Second, I believe that unless this systematic error is corrected, it may be important in the future to rely less heavily on polling data. In a model which only includes four variables, polling plays an important role in determining my prediction. If this systematic error persists, however, it may be important to underweight the latest polls in future models so as to minimize the bias transfered through this variable. This can be done either by including more fundamental variables, which I have emphasized elsewhere, or by using a weighting technique.
3. The Economy: To prioritize simplicity and account for the Harris effect (as described above), I refrained from including economic fundamentals beyond the interaction between Q2 GDP growth and incumbency. While this decision helped my model avoid overfitting and multicollinearity, it may have overlooked other critical economic factors that shaped voter behavior. For instance, Q2 GDP growth captures macroeconomic trends but might fail to reflect the tangible, personal economic pressures voters experience. This raises the question of how strongly individuals feel GDP growth compared to more immediate and visible economic indicators like inflation, wage growth, and/or unemployment.
One of the dominant narratives in this election has been how Biden-era inflation eroded Harris’s prospects, highlighting the importance of personal economic circumstances in shaping voter decisions (New York Times, 2024). To refine my model, I would be curious to re-run it with the inclusion of personal economic indicators such as inflation, wage growth, and unemployment—potentially incorporating these as interaction effects. These variables may provide a more nuanced understanding of voter temperament and how economic realities translate into electoral outcomes.
Final Reflections
I am incredibly proud of the performance of my final model, which, when fully saturated, was able to correctly predict the 2024 election results. By incorporating key variables such as incumbency, GDP growth, lagged vote share, and polling data, I was able to provide a robust prediction that aligned closely with the actual outcome. This success underscores the importance of including fundamental variables, minimizing bias, and maintaining a transparent and interpretable approach to forecasting.
However, in reflecting on this process, I believe there is still room for improvement. Moving forward, it will be important to better understand and account for polling biases and the role of economic indicators in shaping voter sentiment. Given the complexities of modern elections, refining how I incorporate these factors will be essential to improving the accuracy and reliability of my predictions in future models.
Notes
All code above is accessible via Github.
Sources
“Trump’s Win: Why It Wasn’t a Surprise.” The New York Times, November 7, 2024. https://www.nytimes.com/2024/11/07/us/politics/trump-win-election-harris.html.
The Polls Underestimated Trump’s Support Again." Brookings, November 2024. https://www.brookings.edu/articles/the-polls-underestimated-trumps-support-again/.
“2016 Presidential Election Results.” 270toWin, 2024. https://www.270towin.com/2016_Election/.
2020 Presidential Election Results." 270toWin, 2024. https://www.270towin.com/.
The States with the Most Accurate Polls in the 2024 Election." ABC News, 2024. https://abcnews.go.com/538/states-accurate-polls/story?id=115108709.
Data Sources
US Presidential Election Popular Vote Data from 1948-2020 provided by the course. Economic data from the U.S. Bureau of Economic Analysis, also provided by the course. Polling data sourced from FiveThirtyEight.