Who will win the 2024 Presidential Election?
With only one day to go until voting closes across the United States, the time has come to generate my finalized prediction for the 2024 Presidential election. Building off of eight weeks of learning, modeling, and discussing, my final model has been built based on existing scholarship, the successes (and failures) of models over the past week, data availability, and an increased understanding of the unique nature of this election.
Model Formula
My model includes four predictive variables:
- Latest Poll Averages: Polling was covered in week three. The regularized regression model from that post discovered that the weeks with the greatest predictive power were those closest to the election. In this way, the model only includes recent polling data aggregated by FiveThirtyEight. To learn more about how FiveThirtyEight evaluates and weights their polls when generating aggregates, see here.
- The Interaction Between Q2 GDP Growth and Incumbency: In week two we began our discussion of fundamentals, covering the effect of the economy on incumbent vote share. Week two’s model discovered the significant relationship between Q2 GDP growth and vote share, above all other economic variables. This relationship, however, often comes across in the relationship between Q2 GDP Growth and incumbent advantage. If GDP growth is high, individuals may be more likely to re-elect an incumbent president; however, if growth is low, the opposite may take place. Indeed, the incumbency advantage was discussed in week four wherein we weighed the effects of name recognition, pork-barrel spending, and candidate fatigue. Incumbent status proves to be a major predictor of election outcomes; however, this effect is complicated by the candidate switch from Biden to Harris. To account for this, incumbency will only be included in the model as it related to Q2 GDP growth, accounting for the reality that while many voters see Harris as different than Biden, they attribute the low economic growth over the Biden presidency to her.
- Democratic Two-Party Vote Share Lagged One Cycle: In week five, we covered the effects of out final fundamental variable: demographics. As the electorate becomes further calcified, demographics are increasingly predictive of both turnout and election outcomes. It is difficult, however, to predict demographic shifts on existing data. Indeed, lagged vote share serves as a proxy for this variable (and others) by displaying how the state has voted in past elections.
- Democratic Two-Party Vote Share Lagged Two Cycles: By including lagged vote share from both the previous cycle and the one before that, the model is able to account for other shifts within the state — i.e. demographic, turnout, or campaign strategy changes.
Model Strategy
Regression Modeling I decided to use a standard regression to build out my predictive my model. I have three primary reasons for utilizing a regression model as opposed to an ensemble method or a form of machine learning.
- Transparency: In using a regression model throughout the past few weeks, I have attempted to ensure that I am transparent in my assumptions as well as their impact on the models and my overall predictions. My reasoning behind the prioritization of transparency lies in the importance of election forecasting in instilling confidence in U.S. elections. Without forecasting, the American people would have no baseline upon which to gauge election results. In a time where election integrity has been called into question and a team of officials are lined up to discount the results, predictions are a means of giving the public a sense of what to expect on election night, thus simple transparency is key to ensuring the result of my model directly reflects its inputs.
- Interpretability: Building upon the previous point, election forecasts are not just designed to be read by expert data scientists. Rather, large audiences of American citizens rely on forecasts to understand the temperature of the nation going into election night. In this way, it is important that my model be interpretable by audiences beyond a data science sphere. Using a regularized regression model allows me to easily interpret which variables are significant predictors and how, in aggregate, they deliver a prediction.
- Generalizability: Data science, especially as it pertains to election forecasting, is a relatively new field, thus generating a lack of robust data for every variable in my model. Regression models work best at generating generalizable results from limited data without creating extreme model biases.
The first regression model measures the relationship between Democratic two-party vote share and my four predictive variables: the latest poll averages, the interaction effect between Q2 GDP and incumbency, Democratic two-party vote share lagged one cycle, and Democratic two-party vote share lagged two cycles.
##
## =================================================================================
##                                                         Dependent variable:
##                                                   -------------------------------
##                                                   Democratic Two-Party Vote Share
## ---------------------------------------------------------------------------------
## Latest Democratic Poll Averages                          0.713*** (0.028)
## Incumbency and GDP Interaction Effect                     -0.067 (0.049)
## Democratic Two-Party Vote Share Lagged One Cycle         0.382*** (0.028)
## Democratic Two-Party Vote Share Lagged Two Cycles        -0.085*** (0.025)
## Constant                                                 3.628*** (1.041)
## ---------------------------------------------------------------------------------
## Observations                                                    559
## R2                                                             0.805
## Adjusted R2                                                    0.803
## Residual Std. Error                                      4.077 (df = 554)
## F Statistic                                          570.632*** (df = 4; 554)
## =================================================================================
## Note:                                                 *p<0.1; **p<0.05; ***p<0.01
Since my predictive model is regularized with elastic-net and normalized by combining models of both Democratic and Republican two-party vote share (in-depth explanations will follow below), the coefficients and r-squared value of this model are inaccurate representations of my final model. I include them here, however, as a sense-check for the assumptions made above. First, the adjusted r-squared of 0.8 displays that the simple regression model can explain 80% of the variance in Democratic two-party vote share. To me, this emphasizes that the variables included here do a reasonably good job of explaining the attitude of the American electorate when selecting a presidential candidate. Furthermore, for every variable except the Interaction between Incumbency and GDP, the size of each coefficient, as well as their statistical significance, indicate their relative importance in understanding Democratic vote share.
The second regression model measures the relationship between Republican two-party vote share and my four predictive variables: the latest poll averages, the interaction effect between Q2 GDP and incumbency, Republican two-party vote share lagged one cycle, and Republican two-party vote share lagged two cycles.
##
## =================================================================================
##                                                         Dependent variable:
##                                                   -------------------------------
##                                                   Republican Two-Party Vote Share
## ---------------------------------------------------------------------------------
## Latest Republican Poll Averages                          0.636*** (0.024)
## Incumbency and GDP Interaction Effect                      0.026 (0.019)
## Republican Two-Party Vote Share Lagged One Cycle         0.255*** (0.030)
## Republican Two-Party Vote Share Lagged Two Cycles        0.193*** (0.024)
## Constant                                                  -0.210 (1.168)
## ---------------------------------------------------------------------------------
## Observations                                                    559
## R2                                                             0.809
## Adjusted R2                                                    0.807
## Residual Std. Error                                      4.035 (df = 554)
## F Statistic                                          585.451*** (df = 4; 554)
## =================================================================================
## Note:                                                 *p<0.1; **p<0.05; ***p<0.01
These results are incredibly similar to those seen in the Democratic two-party vote share model, indicating both models operate similarly and are very successful in predicting two-party vote share. These sense-checks leave me confident in the variables I have chosen to include within my model going forward.
Regularized Regression When utilizing a regression model, there are two main concerns: overfitting and multicollinearity. To address these concerns, I decided to use an Elastic-Net regularized regression model, which combines both Lasso and Ridge regularization tools to penalize large coefficients and and average the coefficients of correlated predictors. My penalization term, known as alpha, was calculated using cross validation to pick a term wich best fit my model. In doing so, I effectively improved the stability of my model as well as its predictive power.
The first elastic-net regression regularizes the Democratic two-party vote share regression analyzed above
| Variable | Coefficient |
|---|---|
| Intercept | 3.7798307 |
| Intercept 1 | 0.0000000 |
| Latest Democratic Poll Averages | 0.7058158 |
| Incumbency and GDP Interaction Effect | -0.0598857 |
| Democratic Two Party Vote Share Lagged One Cycle | 0.3755114 |
| Democratic Two Party Vote Share Lagged Two Cycles | -0.0751620 |
In comparing the coefficients of this model with the model above, it appears that none of the coefficients underwent significant changes with the use of elastic-net. Indeed, the ideal lambda discovered through cross-validation was 0.03 meaning that my model requires only a small amount of regularization to optimize predictive performance. This means that my model has a low risk of both multicollinearity and overfitting, further emphasizing the strong predictive power of my selected variables. Each coefficient will be evaluated here:
- Latest Poll Averages: This variable has the largest coefficient in the model, making it the most predictive factor for Democratic two-party vote share. Indeed, each 1% increase in the latest Democratic poll averages is associated with a 0.7% increase in the Democratic two-party vote share, suggesting a strong correlation between recent polling and actual voting outcomes.
- The Interaction Between Q2 GDP Growth and Incumbency: This interaction variable captures the effect of having a Democratic incumbent in combination with Q2 GDP growth. A 1-point increase results in a slight decrease (0.06%) in Democratic two-party vote share. This result is especially notable given that the variable’s values range from -8 to 8, indicating that economic conditions tied to the Democratic incumbency have minimal influence compared to more fixed indicators like polling and past vote shares.
- Democratic Two-Party Vote Share Lagged One Cycle: This variable also shows a meaningful positive effect, with a 1% increase in the previous election’s Democratic vote share corresponding to a 0.3% increase in the current two-party vote share. This finding highlights the impact of prior voting behavior as a predictor for subsequent elections.
- Democratic Two-Party Vote Share Lagged Two Cycles: Interestingly, this variable has a small negative coefficient, where a 1% increase two cycles ago is associated with a 0.08% decrease in the current Democratic two-party vote share.
The second elastic-net regression regularizes the Republican two-party vote share regression also analyzed above
| Variable | Coefficient |
|---|---|
| Intercept | 0.0823261 |
| Intercept 1 | 0.0000000 |
| Latest Republican Poll Averages | 0.6316387 |
| Incumbency and GDP Interaction Effect | 0.0231685 |
| Republican Two Party Vote Share Lagged One Cycle | 0.2562105 |
| Republican Two Party Vote Share Lagged Two Cycles | 0.1901908 |
While the lambda found through cross-validation here is slightly higher, sitting around 0.056, the coefficients remain relatively unchanged compared to those found in the aimple regression model above. Once again, this indicates my model has a low risk of both multicollinearity and overfitting, further emphasizing the strong predictive power of my selected variables.
- Latest Poll Averages: The variable for the latest Republican poll averages holds the largest coefficient here, indicating that each 1% increase in poll averages corresponds to a 0.6% increase in the Republican two-party vote share. This highlights the strong predictive power of current polling for the Republican vote share, similar to the pattern seen with the Democratic model.
- The Interaction Between Q2 GDP Growth and Incumbency: This interaction variable, which combines Republican incumbency with Q2 GDP growth, shows a minimal positive effect, where a 1-point increase results in only a 0.02% boost in the Republican two-party vote share. This value is smaller than that observed in the Democratic model (0.06%) and, when combined with the limited range of this variable, becomes nearly negligible in influence.
- Democratic Two-Party Vote Share Lagged One Cycle: A 1% increase in the prior cycle’s Republican vote share is associated with a 0.26% increase in the current Republican two-party vote share. This substantial effect suggests that the most recent past election results serve as an essential indicator of the upcoming vote share for Republicans, consistent with the idea that voting trends from the previous cycle carry forward.
- Democratic Two-Party Vote Share Lagged Two Cycles: Here, a 1% increase in vote share from two election cycles ago correlates with a 0.19% increase in current Republican two-party vote share. This differs notably from the Democratic model, where the two-cycle lagged vote share was relatively insignificant and even showed a slight negative effect. For Republicans, however, both recent and older election outcomes seem to have notable predictive value.
Model Validation
To verify the accuracy of my model in predicting my chosen outcome variables — Democratic and Republican two-party vote share — I decided to perform an out-of-sample performance validation. While I would have liked to display my in-sample error as well, the use of an aggregate elastic-net model predicted onto state-based variables makes it incredibly difficult, thus I will instead focus on out-of-sample error.
Using Bootstrapped Out-of-Sample Error Estimation to Test Predictive Power:
| Party | Mean Error | Standard Deviation |
|---|---|---|
| Democratic | -0.2518568 | 6.260530 |
| Republican | 0.4969762 | 6.017972 |
The mean error for Democrats is around -0.25, indicating the model tends to slightly underestimate Democrat performance. The mean error for Republicans is around 0.5, indicating the model tends to slightly overestimate Republican performance. That said, the values are close to zero, suggesting the models do not have a significant directional bias in their predictions. A standard deviation of around 6 for both, however, is relatively high, especially in the context of vote share predictions. A high standard deviation (relative to the mean error) suggests that individual predictions vary considerably from the true values. While this finding is worrying, it is not indicative of a bad model, rather it emphasizes the limited data availability and high uncertainty in the election forecasting industry as a whole.
Predicting Vote Share
As I have done in the previous three weeks, I will be predicting for the seven states which expert predictors like Cook and Sabato determine to be toss-ups in the upcoming election: Arizona, Nevada, Michigan, Wisconsin, North Carolina, Georgia, and Pennsylvania. Using the elastic-net regularized regression model generated above, which includes four predictive variables, my models calculated both Democratic and Republican two-party vote share.
When interpreting the results below, bear in mind that the predicted two-party vote shares sum to above 100 as a result of the data used in this model. The data will be normalized below; however, the raw model results are included for the sake of evaluating the confidence intervals for each state.
Model of Elastic-Net Regularized Regression Predicted Two-Party Democratic Vote Share with 90% Confidence Intervals for Swing States
| State | Predicted Vote Share | Upper Bound | Lower Bound |
|---|---|---|---|
| Arizona | 51.59982 | 56.81396 | 46.38569 |
| Georgia | 52.06712 | 57.28126 | 46.85298 |
| Michigan | 52.88262 | 58.09676 | 47.66849 |
| Nevada | 52.28355 | 57.49769 | 47.06941 |
| North Carolina | 51.76715 | 56.98129 | 46.55301 |
| Pennsylvania | 52.49332 | 57.70746 | 47.27918 |
| Wisconsin | 52.73629 | 57.95042 | 47.52215 |
Model of Elastic-Net Regularized Regression Predicted Two-Party Republican Vote Share with 90% Confidence Intervals for Swing States
| State | Predicted Vote Share | Upper Bound | Lower Bound |
|---|---|---|---|
| Arizona | 53.68981 | 58.84942 | 48.53021 |
| Georgia | 53.51498 | 58.67459 | 48.35538 |
| Michigan | 51.79185 | 56.95145 | 46.63224 |
| Nevada | 52.06144 | 57.22105 | 46.90184 |
| North Carolina | 53.50122 | 58.66082 | 48.34162 |
| Pennsylvania | 52.56941 | 57.72901 | 47.40981 |
| Wisconsin | 52.31164 | 57.47124 | 47.15203 |
The 90% confidence interval of these predictions includes both election outcomes, indicating the extreme variability of the model. This variability suggests that the predictions are sensitive to small changes in input, reflecting the inherent uncertainty in election forecasting. Since election prediction models rely on a limited set of data points and may not fully capture unforeseen events or shifts in voter sentiment, it is common for confidence intervals to span both possible outcomes. Such wide intervals remind us that while the model offers a probabilistic view of the election, it should not be interpreted as a definitive forecast.
Normalizing the Two-Party Vote Share in my Models to Generate a Final Prediction
Since my values for two-party vote share sum to over 100, I normalized them through a simple formula of deviding each party’s prediction by a sum of both parties’ predictions. Doing so generated the results displayed below:
| State | Democratic Prediction | Republican Prediction | Winner |
|---|---|---|---|
| Arizona | 49.00750 | 50.99250 | Trump |
| Georgia | 49.31434 | 50.68566 | Trump |
| Michigan | 50.52103 | 49.47897 | Harris |
| Nevada | 50.10643 | 49.89357 | Harris |
| North Carolina | 49.17636 | 50.82364 | Trump |
| Pennsylvania | 49.96379 | 50.03621 | Trump |
| Wisconsin | 50.20212 | 49.79788 | Harris |
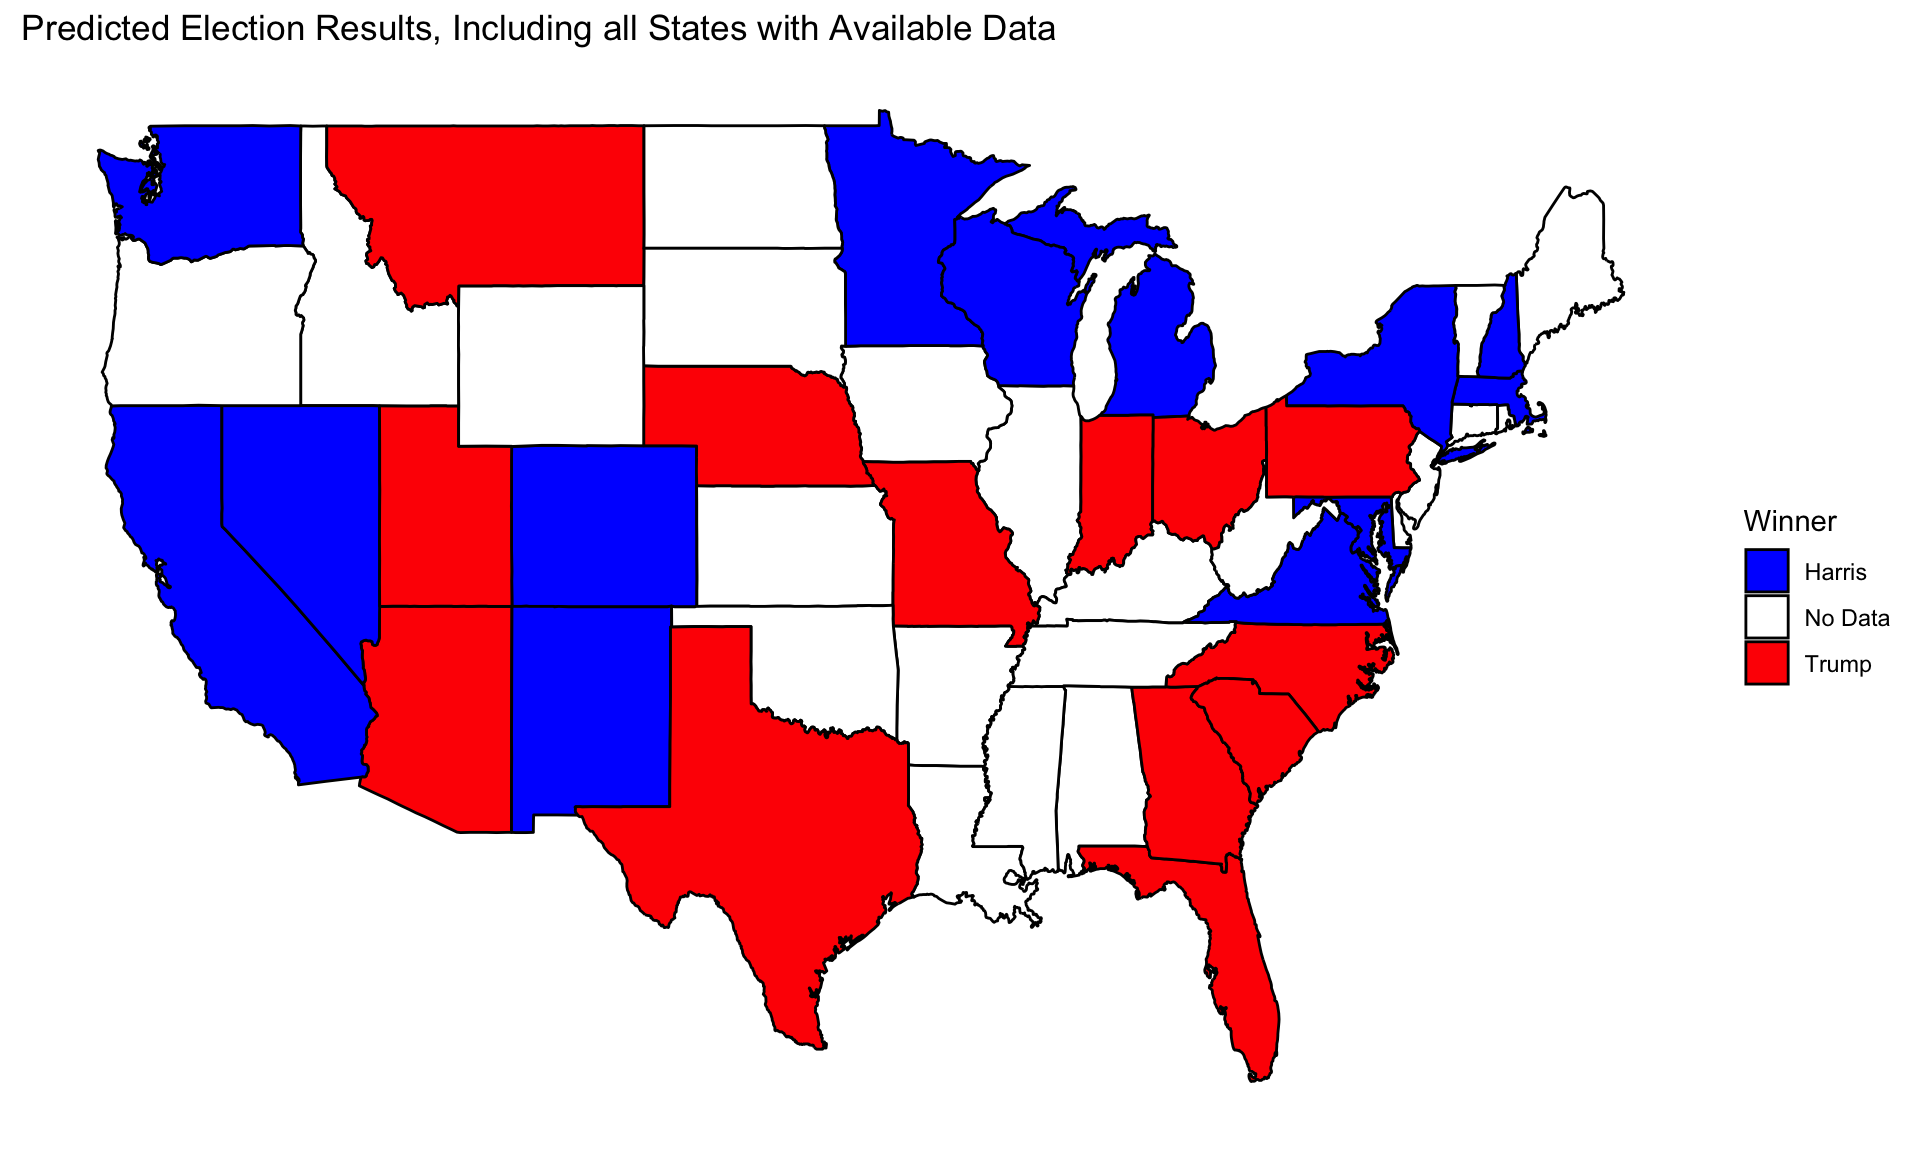
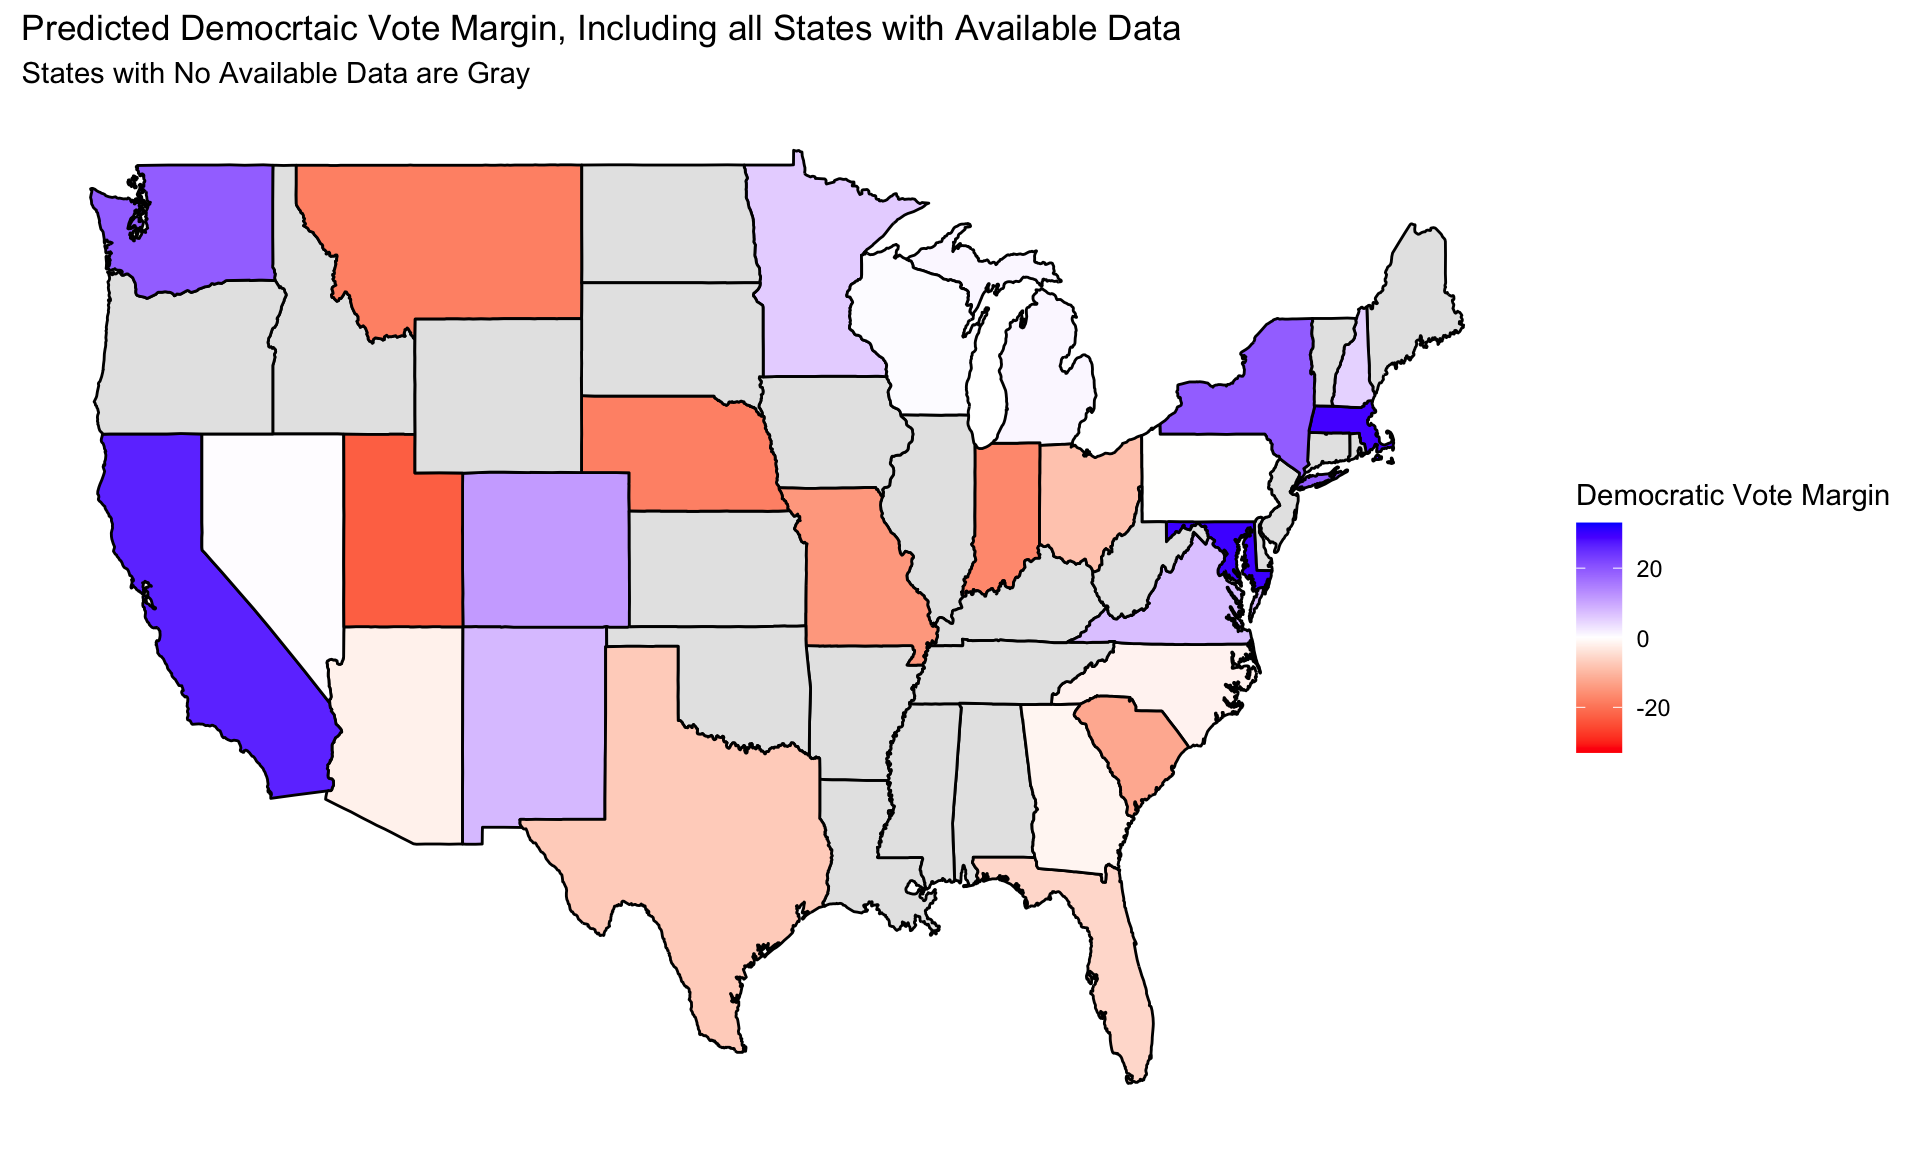
Final 2024 Prediction
In normalizing both predictions, Harris appears to win Michigan, Nevada, and Wisconsin on a slim margin, while Trump wins Arizona, Pennsylvania, Georgia, and North Carolina on similarly slim margin. This leads to a result where Trump wins with 281 electors while Harris has 257 electors.
Notes
All code above is accessible via Github.
Data Sources
US Presidential Election Popular Vote Data from 1948-2020 provided by the course. Economic data from the U.S. Bureau of Economic Analysis, also provided by the course. Polling data sourced from FiveThirtyEight.