What are the connections, if any, between demographics and voter turnout?
When visiting our class a month ago, FiveThirtyEight’s Elliott Morris was asked what variable he wishes he had complete access to for the sake of improving the predictive power of his forecasting models. His answer: voter turnout. While forecasters may be able to develop models which accurately gauge the sentiment of the electorate, without information on voter turnout there is no way to accurately extrapolate such “temperature checks” into accurate election predictions. Yet, pollsters struggle to accurately gauge voter turnout with survey data. Indeed, forecasters often turn to demographics, hoping to impute turnout based on the likelihood of certain populations to turn out to vote. To do so, an assumption must be made that demographic information is able to predict voter turnout. This assumption will be explored below:
General Election Turnout in Pennsylvania Based on Demographic Information
The charts below are a very basic demonstration of the average number of Pennsylvania general elections that individuals have voted in broken down by various demographic informants. Pennsylvania was chosen as it is a relatively diverse state in terms of demographic and political viewpoint as well as a key swing state in the upcoming election. When looking at the charts, it is important to keep in mind that relative population size is not incorporated into these models. Additionally, there is general election data every year going back 23 years.
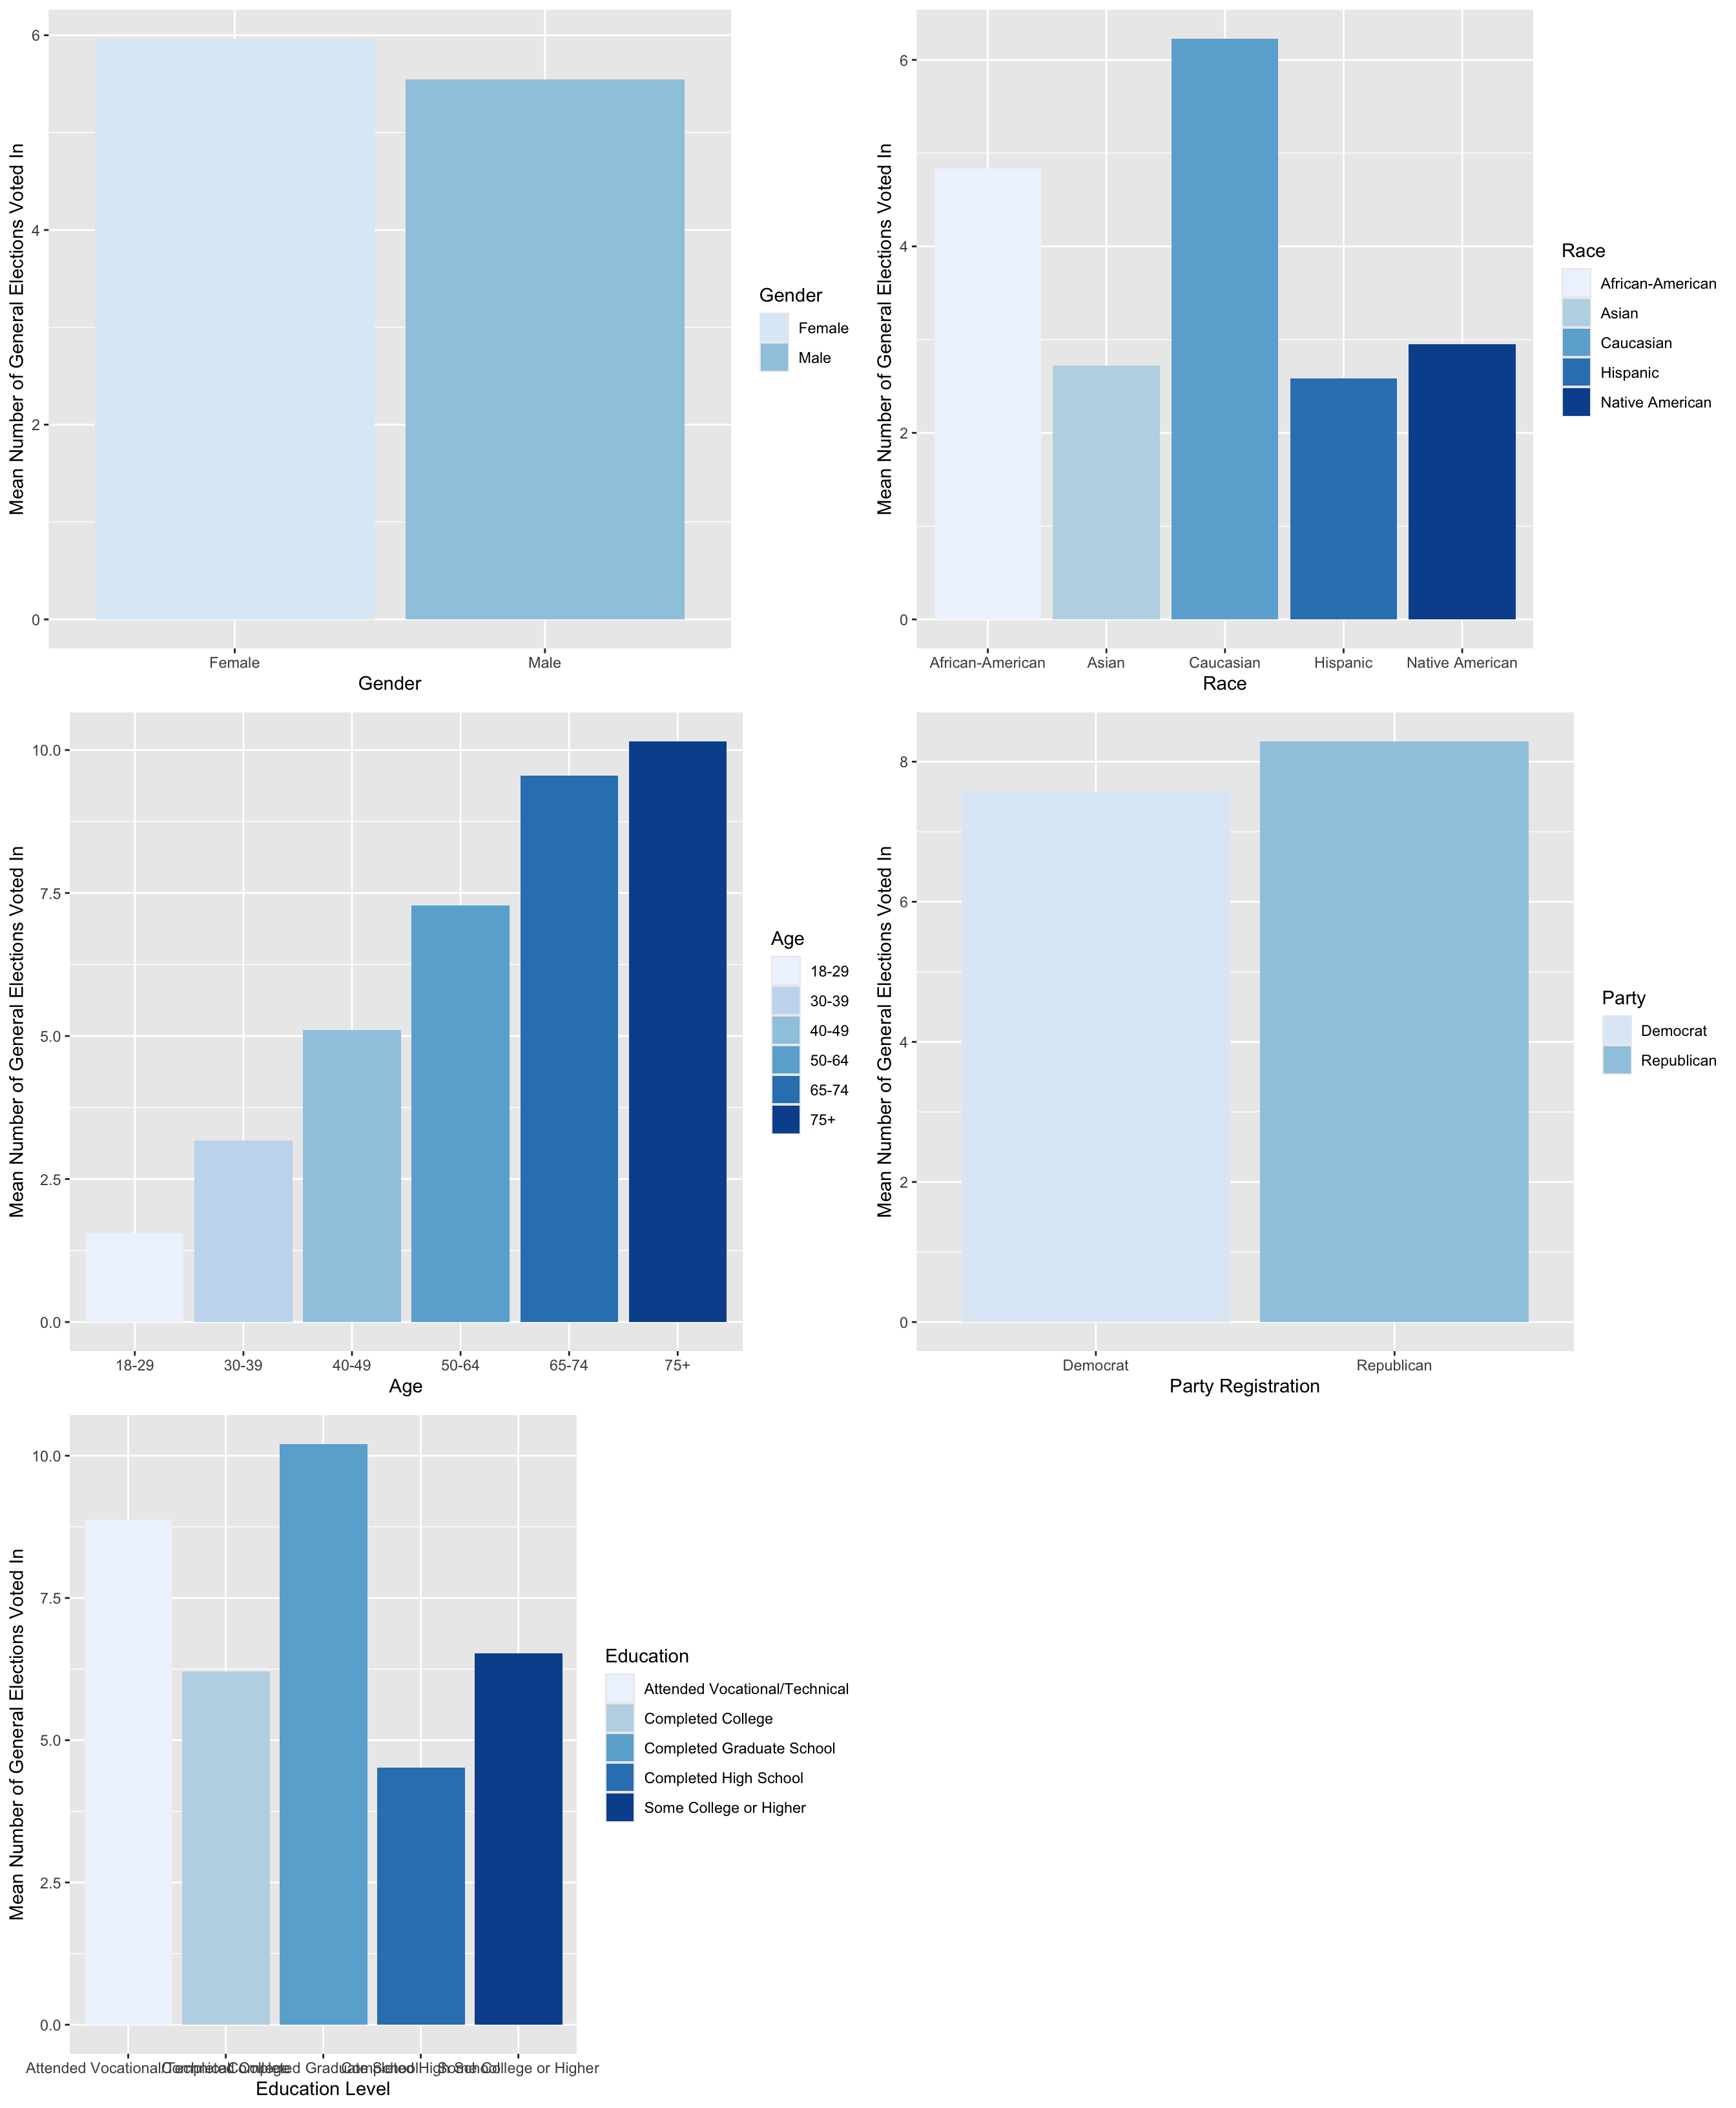
The charts above illustrate that certain demographics — white, educated, older people — appear to vote more frequently than others in general elections. There are many reasons for these differences. In their book, The Turnout Myth, Shaw and Petrocik outline a few, most importantly: educated voters have more information and a greater sense of civic duty while older voters have more time and greater interest in government programs (Shaw and Petrocik, 2020). Yet, to understand how this information applies to election predicting, it is important to understand if this demographic information can predict vote choice in these elections. For a long time, forecasters operated under a bias thesis which assumed that democrats were more likely to turnout to vote because of these demographic indicators. The analysis below will determine if that is still true.
Can demographics and turnout be used to predict election outcomes?
To understand if demographics are predictive of vote choice, I recreated an analysis done by Kim and Zilinksy which uses a logistic regression model to determine which demographics have predictive power(Kim and Zilinsky, 2024).
Evaluating in-sample fit:
Table: Table 1: Logistic Regression Coefficients and Significance
| Estimate | Standard Error | z_value | Significance | |
|---|---|---|---|---|
| (Intercept) | 4.3583814 | 0.4366803 | 9.9807136 | *** |
| age | 0.0006984 | 0.0028117 | 0.2483989 | |
| gender | -0.4294732 | 0.0934585 | -4.5953379 | *** |
| race | -0.5482380 | 0.0605982 | -9.0470969 | *** |
| educ | -0.3398141 | 0.0613322 | -5.5405495 | *** |
| income | 0.0494349 | 0.0468039 | 1.0562135 | |
| religion | -0.2148136 | 0.0421012 | -5.1023208 | *** |
| attend_church | -0.2109916 | 0.0331518 | -6.3644005 | *** |
| southern | -0.4096051 | 0.1051603 | -3.8950560 | *** |
| work_status | 0.0955178 | 0.0458378 | 2.0838220 | * |
| homeowner | -0.1765531 | 0.0822755 | -2.1458777 | * |
| married | -0.0715981 | 0.0276917 | -2.5855402 | ** |
## Confusion Matrix and Statistics
##
##             Reference
## Prediction   Democrat Republican
##   Democrat        746        336
##   Republican      346        660
##
##                Accuracy : 0.6734
##                  95% CI : (0.6528, 0.6935)
##     No Information Rate : 0.523
##     P-Value [Acc > NIR] : <2e-16
##
##                   Kappa : 0.3456
##
##  Mcnemar's Test P-Value : 0.7304
##
##             Sensitivity : 0.6832
##             Specificity : 0.6627
##          Pos Pred Value : 0.6895
##          Neg Pred Value : 0.6561
##              Prevalence : 0.5230
##          Detection Rate : 0.3573
##    Detection Prevalence : 0.5182
##       Balanced Accuracy : 0.6729
##
##        'Positive' Class : Democrat
##
According to the first table, the logistic regression finds six demographic variables significant in predicting vote choice at the 0.001 level. Those variables are gender, race, education, religion, church attendance, and whether or not a voter is from the south. Furthermore, marriage appears predictive at the 0.01 level and home ownership and employment at the 0.05 level. When looking at the confusion matrix, it appears that this model can accurately predict an individual’s political party with 67% accuracy.
Evaluating out-of-sample fit:
## Confusion Matrix and Statistics
##
##             Reference
## Prediction   Democrat Republican
##   Democrat        184         80
##   Republican       88        169
##
##                Accuracy : 0.6775
##                  95% CI : (0.6355, 0.7175)
##     No Information Rate : 0.5221
##     P-Value [Acc > NIR] : 4.301e-13
##
##                   Kappa : 0.3547
##
##  Mcnemar's Test P-Value : 0.5892
##
##             Sensitivity : 0.6765
##             Specificity : 0.6787
##          Pos Pred Value : 0.6970
##          Neg Pred Value : 0.6576
##              Prevalence : 0.5221
##          Detection Rate : 0.3532
##    Detection Prevalence : 0.5067
##       Balanced Accuracy : 0.6776
##
##        'Positive' Class : Democrat
##
The out-of-sample confusion matrix yields similar results within a smaller subset of the data.
These results, which assert that demographic data can explain about 60% of vote choice, are interesting. On the one hand, this number is significant and growing as voters become calcified within parties which are now split by identity politics. Yet, given the historical emphasis on the bias thesis, the finding that demographic data only explains 60% of vote choice is surprisingly low. Although factors which are strong indicators of turnout, like race and education, also serve as predictors of vote choice, the two do not appear to have a very strong correlation. Indeed, this suggests that other factors—such as candidate appeal, political issues, and voter sentiment—are increasingly important in influencing electoral turnout and vote choice.
Using this model, how can demographics predict the outcome of the 2024 election?
Although demographic can only explain 60% of vote choice, I was interested in using a version of the regression model generated above to understand the outcome of the election if we were to assume an individuals age, race, gender, and education status to be entirely predictive of their vote choice. That is to say, if political party were based solely on demographic, how would the seven most influential swing states in the upcoming election vote.
To build this prediction I utilized a random 1% sample of voter files for every registered voter in each of the swing states (data courtesy of Statara Solutions). I then utilized a simplified version of the logistic regression model developed above to predict the number of individuals who would vote for each party based on their demographic information. The results are summarized here:
| State | Democrat | Republican | Winner |
|---|---|---|---|
| Pennsylvania | 40007 | 64378 | R |
| Nevada | 11842 | 13239 | R |
| Arizona | 25873 | 29731 | R |
| Wisconsin | 17841 | 43051 | R |
| Michigan | 34541 | 56722 | R |
| North Carolina | 36797 | 45908 | R |
| Georgia | 34541 | 56722 | R |
Using demographic as a predictor of vote choice, the model generated above predicted that every swing state in the upcoming election voted Republican. Since these results were rather jarring, I decided to ensure the accuracy of my model by running the same prediction with New York State. The result was that based on demographic alone, New York would vote Democrat (as they have in every recent general election).
Indeed, accepting htis model as relatively unsophisticated but correct, the table above indicates that using demographic as a sole predictor would lead to former president Trump receiving 312 electoral college votes. These results are incredibly interesting, asserting that demographic cannot possibly be entirely predictive of election outcomes, despite what calcification theory, identity politics, and the media would lead us to believe.
What is an alternative predictive method? (Not part of post 5)
To generate a more accurate, stimulated model which incorporates demographic into the work we have been doing over the past few weeks, I used a state’s previous vote swing and turnout to impute data. This model predicts democratic victories in each of the seven swing states, thus generating a prediction wherein Harris has 319 electoral votes and Trump has 219.
Notes
All code above is accessible via Github.
Sources
Kim, Seo-young Silvia, and Jan Zilinsky. “Division Does Not Imply Predictability: Demographics Continue to Reveal Little about Voting and Partisanship.” Political Behavior 46, no. 1 (2022): 67-87. https://doi.org/10.1007/s11109-022-09816-z.
Shaw, Daron R., and John R. Petrocik. The Turnout Myth : Voting Rates and Partisan Outcomes in American National Elections. New York, NY: Oxford University Press, 2020.
Data Sources
US Presidential Election Popular Vote Data from 1948-2020 provided by the course. Demographic data sourced from ANES. Current state-by-state voter file data sourced from Stratara Solutions, provided by the course.