What is the advantage of incumbency in presidential elections?
There have been 18 presidential elections since World War II, eleven of which featured an incumbent president running, seven of whom won re-election. Indeed, while an incumbent president has won re-election in 33% of elections since WWII, the incumbent party has won over 44% of such presidential elections. These results highlight a key reality in U.S. politics: incumbency is a major advantage for both politicians and parties in the context of a presidential election.
How many incumbent presidents have been re-elected since WWII?
| Was the incumbent president re-elected | Count | Percent |
|---|---|---|
| FALSE | 12 | 66.67 |
| TRUE | 6 | 33.33 |
How many incumbent parties have been re-elected since WWII?
| Was the incumbent party re-elected | Count | Percent |
|---|---|---|
| FALSE | 10 | 55.56 |
| TRUE | 8 | 44.44 |
Historically, why do incumbents have this advantage?
As seen above, incumbency presents a huge advantage for both presidents and their parties within presidential elections. Scholar Alfred Cuzán describes this effect as one of the five laws of politics — the law of incumbent advantage. Cuzán’s second of the five laws, however, paints a more complicated picture of this effect. The law of shrinking support asserts that despite the incumbent advantage in the presidential election, all but one incumbent party has lost vote share in midterm house election since WWII (Cuzán, 2015). This is often due to a phenomenon called mean reversion wherein parties who overperform and gain marginal seats in one election, will typically revert to the mean in the next election, returning to their historical average number of seats.
The law of incumbent advantage is, thus, specific to the office of the president. First and foremost, presidents are able to shape public opinion because of high esteem and recognition. Incumbents are able to begin their campaigns for re-election from the second that they arrive in the oval office, giving them a jumpstart on the race. Furthermore, according to Kriner and Reeves, presidents can use the distribution of federal funds to garner electoral support (Kriner and Reeves, 2012) This phenomna is called pork barrel spending and is analyzed below:
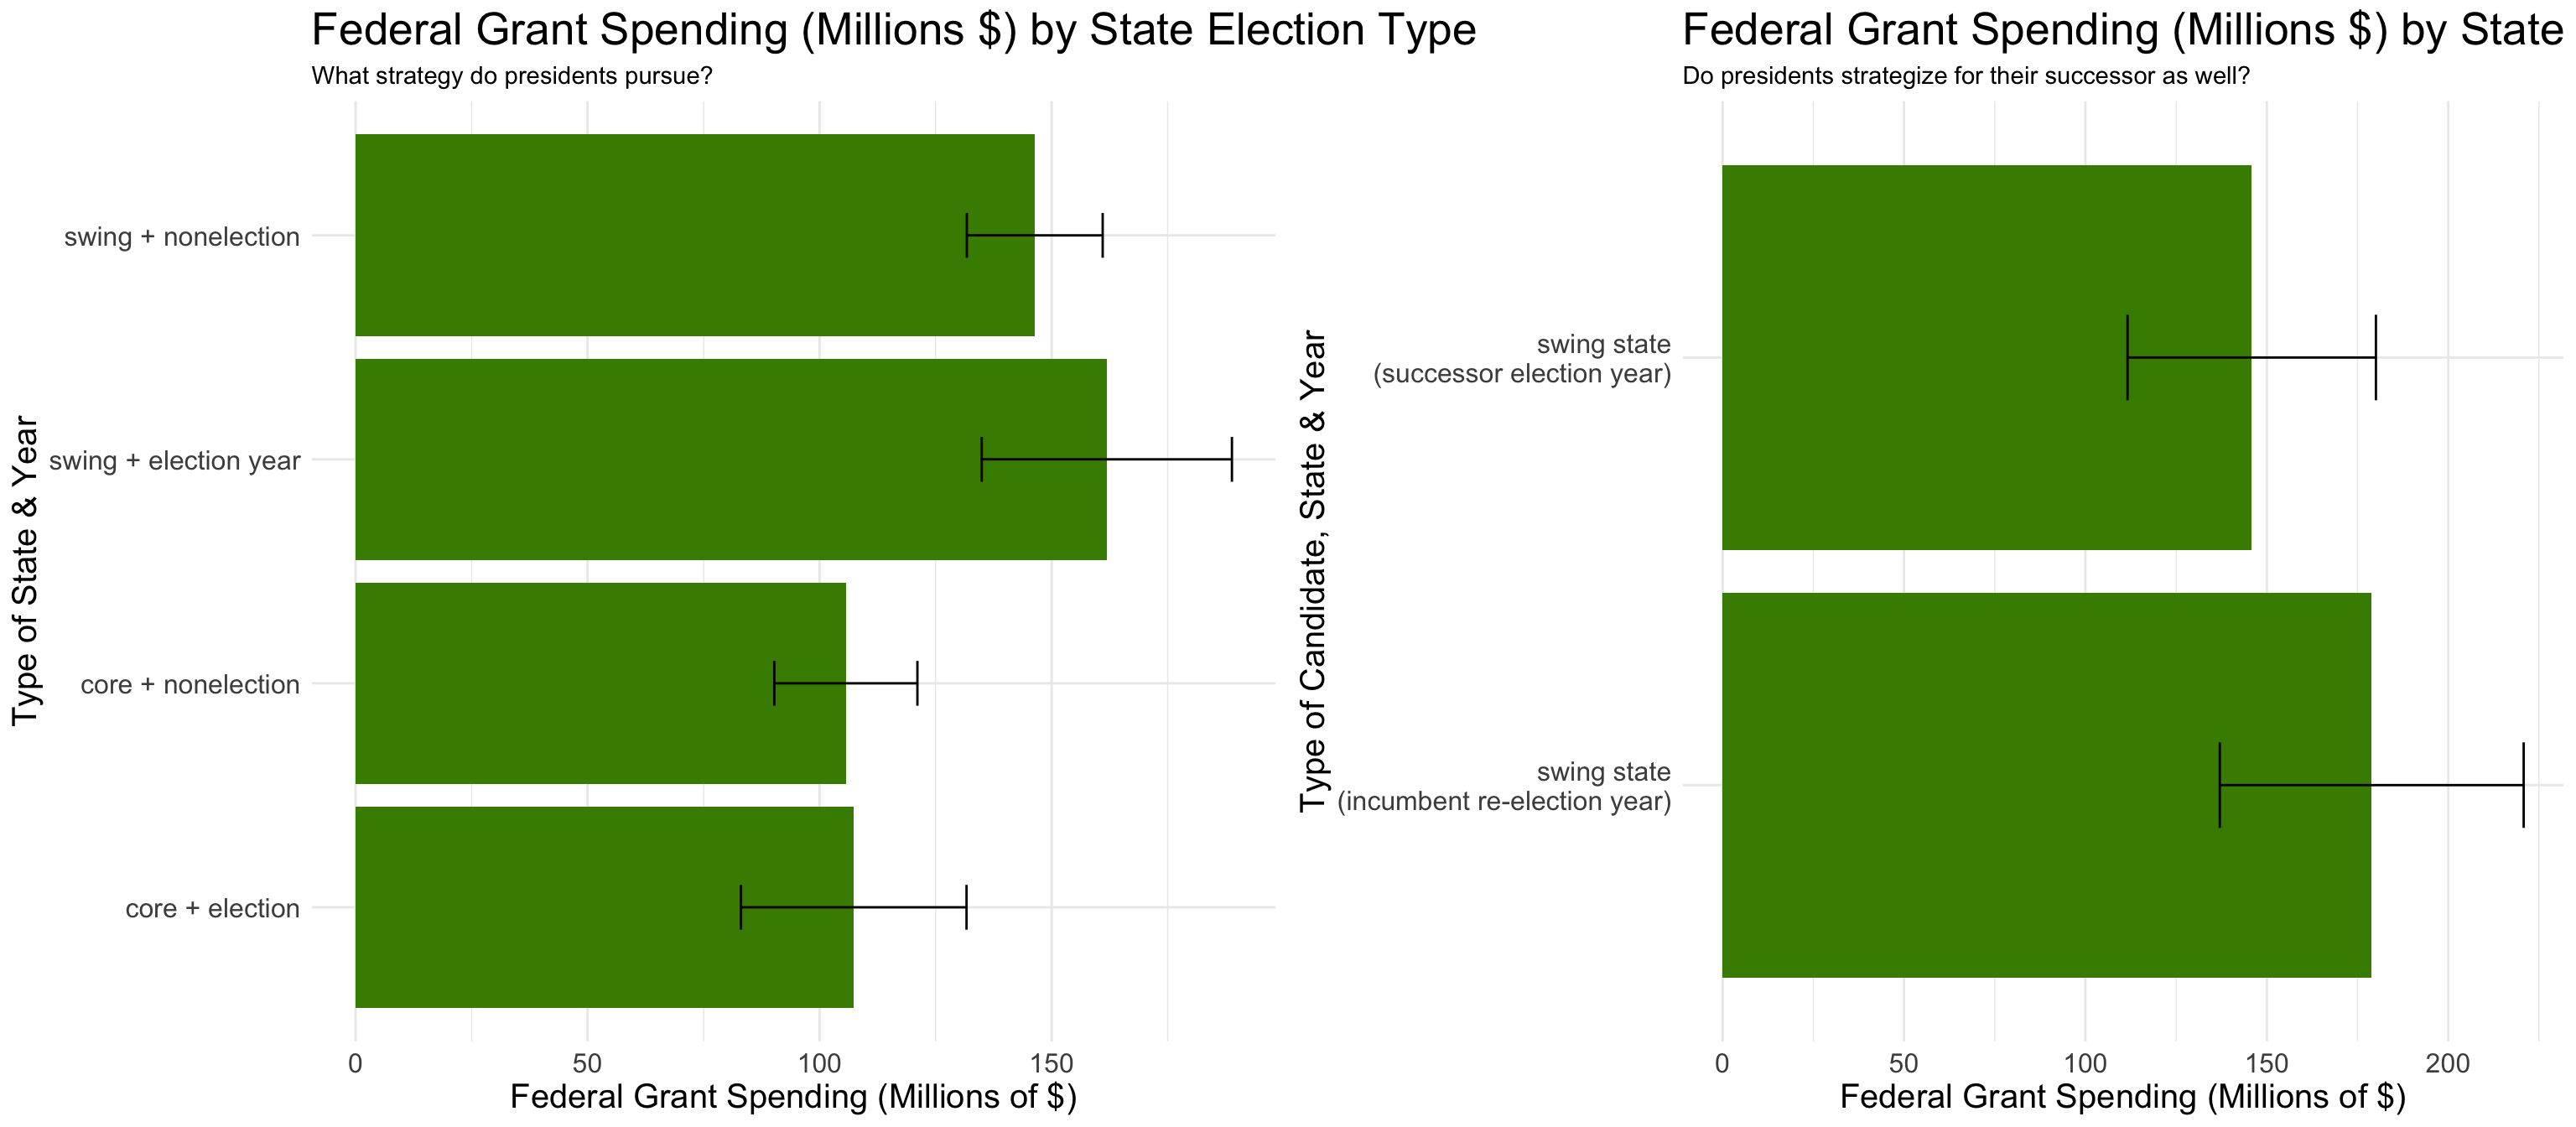
As seen above, federal grant spending in swing states is significantly higher than in non-swing states. Furthermore, this spending increases significantly in an election year. Finally, this effect applies both to incumbents and their successors.
To analyze the relationship between incumbent vote share and federal grant spending at the county level, a bivariate regression was run which resulted in an r-squared value of 0.4, meaning this model can explain 40% of the variance in incumbent vote share. The model asserts that both grant spending and the competitiveness of states influence incumbent vote share, a finding which is statistically significant at the 0.001 level. The model also indicates that the coefficients for years 1996, 2004, and 2008 are significantly larger than the base year, suggesting important temporal effects during these elections. When analyzing a separate bivariate regression model which uses grant data at the state level, these temporal effects persist in 1996 and 2004, indicating significant pork barrel spending by Bush and Clinton to support their re-election campaigns.
Can incumbency build a predictive model?
While federal grant data for 2024 is not yet available, incumbency can be easily used in predictive models by incorporating variables for whether or not a candidate is an incumbent as well as the president’s approval rating. One such model, which incorporates both of these statistics as well as Q2 GDP growth, was made by the political scientist Alan Abramowitz. Abramowitz’s Time for Change model had a true out-of-sample PV prediction error of 1.7% between 1992 and 2016.
| Prediction Models | Predicted 2024 Democratic Voteshare | Lower Bound (95% PI) | Upper Bound (95% PI) |
|---|---|---|---|
| Time for Change Model (2016) | 48.92874 | 43.09807 | 54.75942 |
| Simplified Time for Change Model (2020) | 47.39554 | 40.52536 | 54.26573 |
The table above uses both Abramowit’s 2016 model as well as his simplified 2020 model to predict the results of the 2024 election. The 2016 model includes incumbency advantage (as determined by incumbency status as well as June approval ratings) as well as GDP growth quarterly. To better understand the inclusion of economic fundamentals, refer to blog post two. This model estimates a 48.93% two-party popular vote share for Vice President Harris. To make this prediction, a prediction interval of 95% was used, meaning that there is only a 5% chance the real election outcome does not fall within the upper and lower bounds noted above. The 2020 time for change model only utilizes June approval ratings as a predictor due to the complicated nature of the Q2 economy in 2020, estimating a 47.4% two-party popular vote share for Vice President Harris.
These two predictions differ significantly than those produced in previous weeks, primarily because they rely on Biden’s incumbency status and approval ratings despite the reality that Biden is no longer the democratic candidate for president. Indeed, in June (the month of the first presidential debate) Biden’s approval rating was -22, which is certainly not the case for his younger successor Kamala Harris. The complicated narrative of this election makes it difficult to incorporate incumbency advantage into a predictive model.
How do expert predictors use models such as these to predict election outcomes?
Expert predictors, such as those from the Cook Political Report and Sabato’s Crystal Ball, use a combination of statistical modeling and expert qualitative insights to create comprehensive, real-time predictions. Much of the quantitative aspect of these models is similar to those I’ve crafted in my blogs over the past few weeks; however, these prediction models also include qualitative adjustments based on expert judgment. Additionally, expert predictors often use a probabilistic framework, labeling states “Safe,” “Likely,” “Lean,” or “Toss-up” based on the strength of each party’s position. Instead of predicting exact vote shares, these models indicate which states are too close to call and, thus, will become the focal point for this election cycle.
2020 Electoral College Expert Predictions
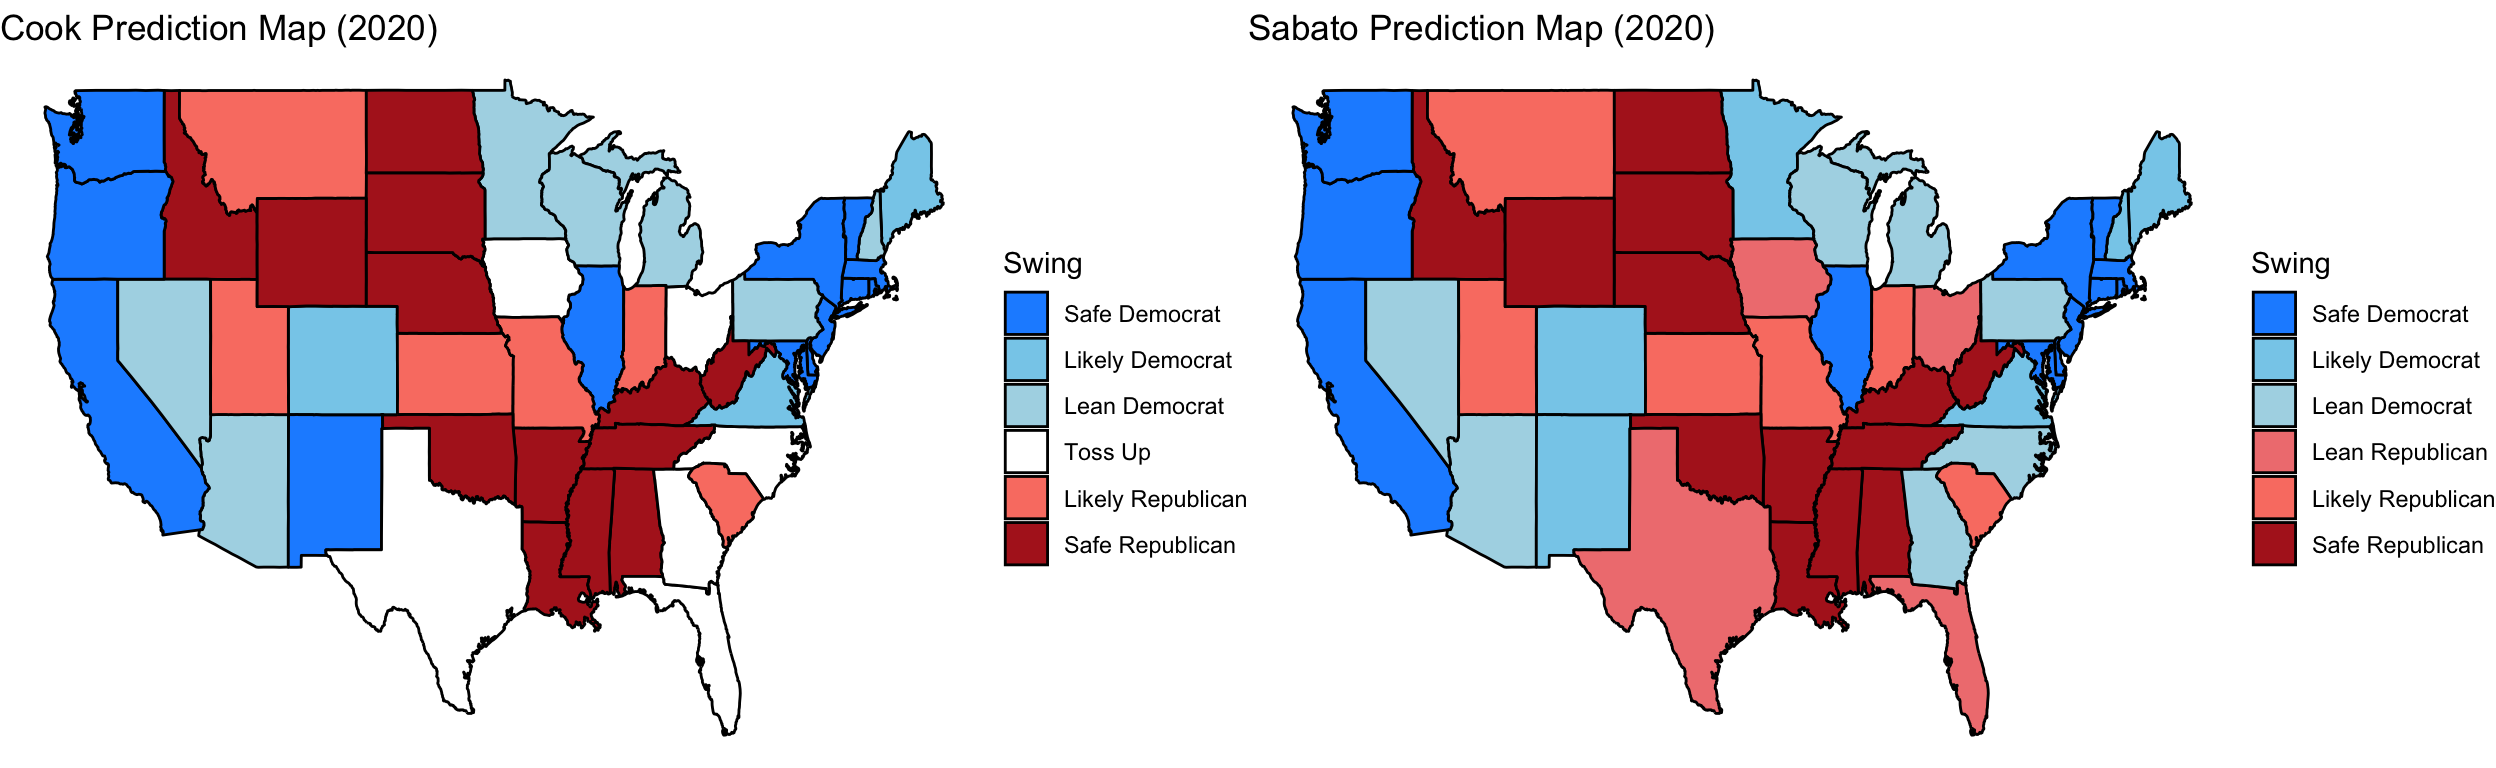
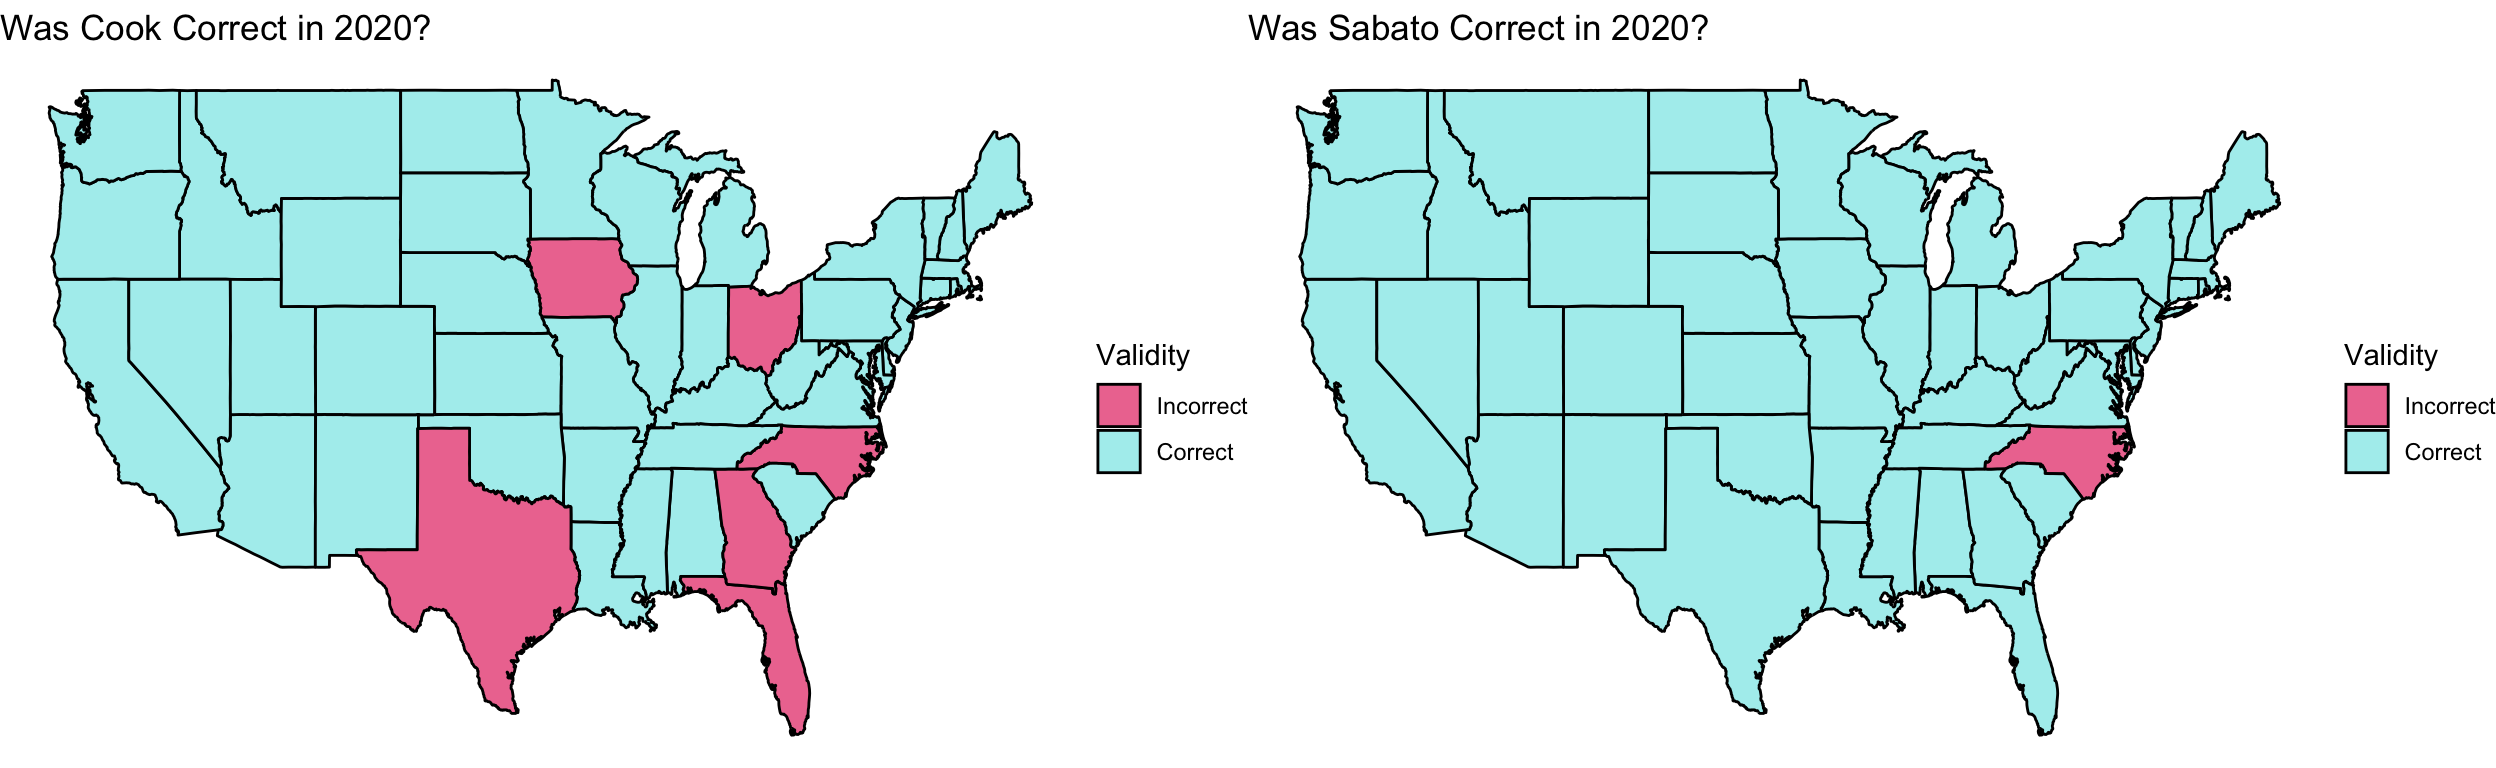
As seen in the maps above, Sabato’s model seemingly had more success than Cook’s model in predicting the results of the 2020 election. In reality, by including five toss-up states in his final model, Cook was not actually incorrect; rather, in his pursuit of probabilistic accuracy, he chose to remain vague and label the states as too close to call for either party.
Expert models can provide valuable insights into a party’s hold (or lack thereof) on certain states, which is crucial for predicting the electoral college. Therefore, moving forward, insights from both Cook and Sabato will be important in determining which states to focus on for my electoral college predictions.
Notes
All code above is accessible via Github. To learn more about expert predictions such as those made by the Cook Political Report and Sabato’s Crystal Ball, see here!
Sources
Abramowitz, Alan. “Time for Change Model Predicts Close Election with Slight Edge for Kamala Harris.” The Center for Politics. Rector and Visitors of the University of Virginia. Last modified August 22, 2024. Accessed September 29, 2024. https://centerforpolitics.org/ crystalball/time-for-change-model-predicts-close-election-with-slight-edge-for-kamala-harris/.
Cuzán, Alfred G. “Five Laws of Politics.” PS: Political Science & Politics 48, no. 03 (2015): 415-19. https://doi.org/10.1017/s1049096515000165.
Kriner, Douglas L., and Andrew Reeves. “The Influence of Federal Spending on Presidential Elections.” American Political Science Review 106, no. 2 (2012): 348-66. https://doi.org/ 10.1017/s0003055412000159.
Data Sources
US Presidential Election Popular Vote Data from 1948-2020 provided by the course. Economic data from the U.S. Bureau of Economic Analysis, also provided by the course. Polling data sourced from FiveThirtyEight and Gallup, also provided by the course.