How can we best use polls to predict election outcomes?
Polls are central to understanding democratic discourse as they measure the average person’s opinion. Since January 1, 2024 there have been 13,626 large-scale presidential polls conducted to gauge sentiment towards the general election candidates. From 1968 to 2020, general election polling has largely been an accurate predictor of election outcomes, with an average polling miss of 1.58 percentage points in terms of popular vote. Much of this accuracy stems from a concept which dates back to Galton’s Ox, wherein a large sample of guesses — or, in this case, opinions — will generate an average that accurately approximates the general opinion due to the cancellation of error in both directions. (Galton, 1907)
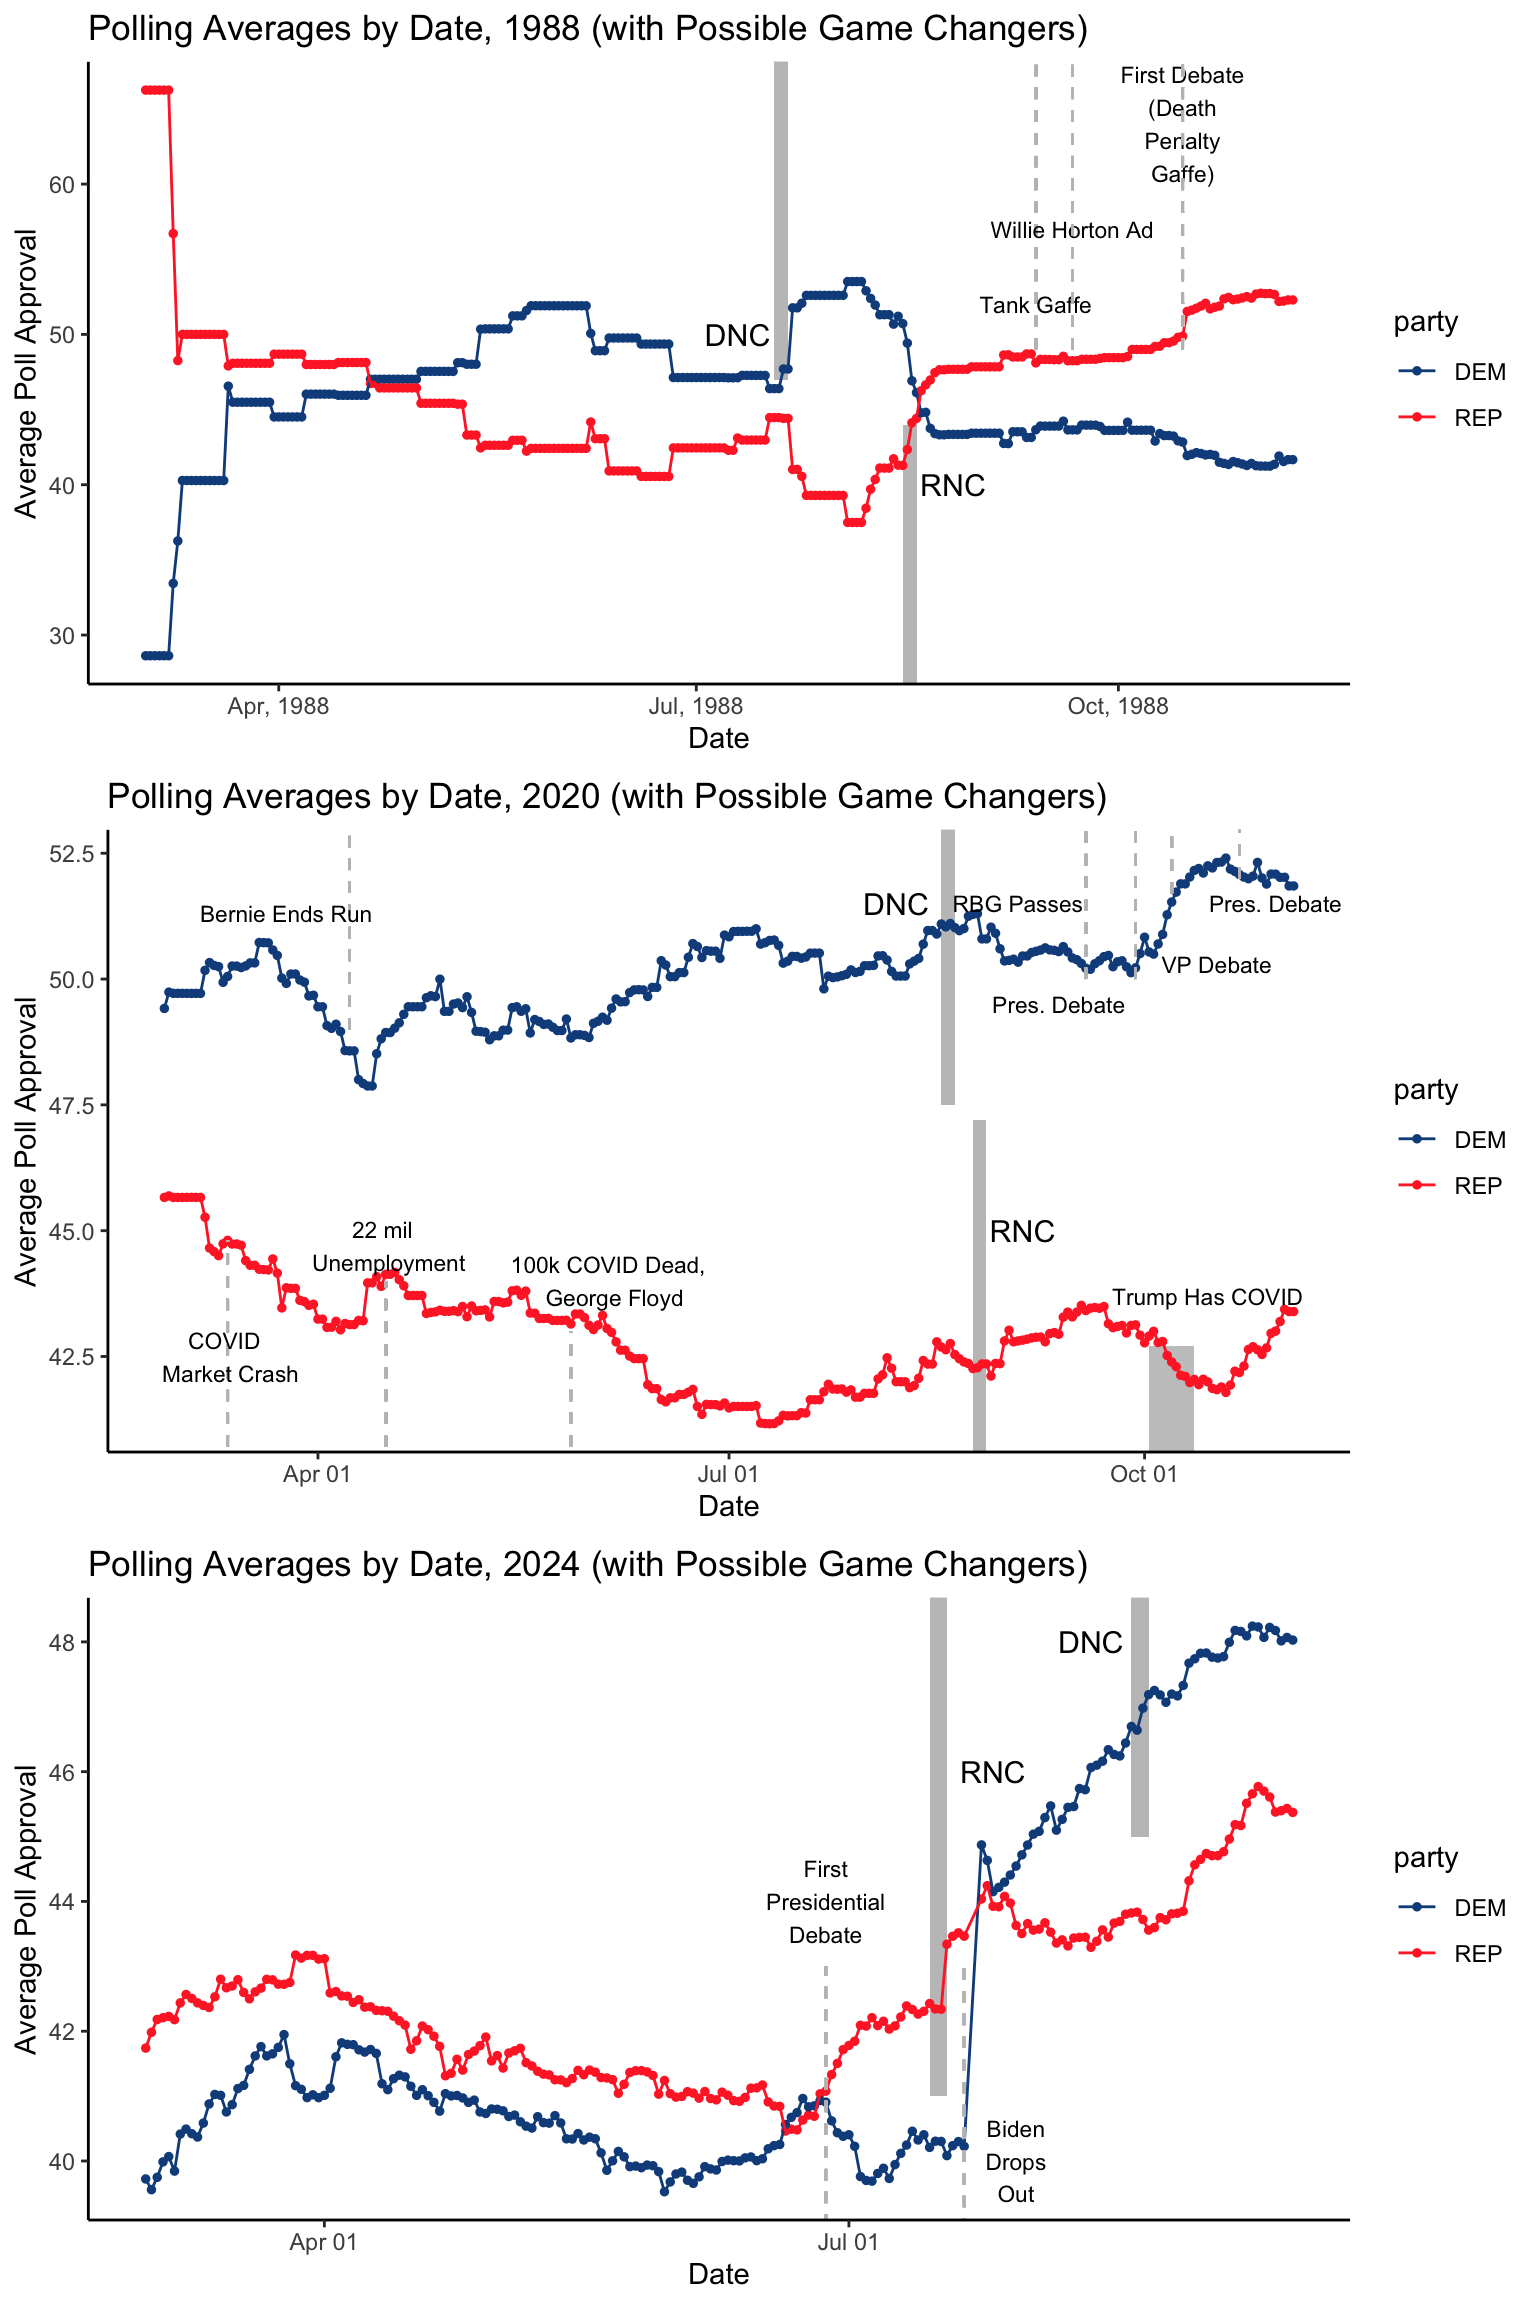
Despite the general accuracy of polling right before election day, throughout an election cycle polls are often incredibly variable due to changes in sampling groups, incomplete information, or news events which temporarily alter opinion. The variability of polling is on display in the graphic below, accompanied by the dates of major events which are thought to effect polling, at least temporarily. The 1988 election is representative of polling before the digital era, while the 2020 election is the most recent general election. Data on 2024 polling thus far is also included.
Historically, how have polls been used to predict elections?
Different pollsters have disparate methods of approaching poll-based predictions. To better understand various methods of predicting, I will briefly compare the methods used by two preeminent pollsters, Nate Silver, the former director of FiveThirtyEight, and Elliott Morris, FiveThirtyEight’s current director. Both Morris and Silver use a combination of weighted polling data as well as economic and political fundamentals to predict the outcome of the election. Silver’s model relies heavily on polling data, generating aggregates based on the FiveThiryEight weighting technique while also adjusting to incorporate the likely-voter effect, the house effect, and the timeline effect. Furthermore, Silver weights polling data more heavily than fundamental data — for which he uses only six economic indicators — especially in the weeks leading up to the election (Silver, 2020).
After Nate Silver’s model failed to accurately predict the 2016 election, Elliott Morris shifted his model’s strategy. The Morris model relies heavily on fundamental data, including 11 economic indicators. According to Morris, a baseline fundamental model which includes past elections and economic data should steer the ship by providing an upper and lower bound for estimates which include polling data. Furthermore, Morris utilizes an enhanced understanding of geographic location and demographic information to evaluate and weight polling data (Morris, 2024).
Due to the chaotic nature of this election cycle wherein the Democratic candidate changed 15 weeks before the election, I believe it makes more sense to weight fundamental factors heavier than polling data while weighting recent polling data much heavier than data from before Harris took over. This model more closely resembles the Elliott Morris approach. For the sake of accuracy, however, the prediction generated below will weight fundamentals and polling data equally as there is still very little polling data with Harris as the candidate and I am careful not to bias my prediction.
Can polling data build a predictive model?
To understand how well polls predict the outcome of general elections, I will use a multivariate regression which relates aggregate polling data beginning 30 weeks before election day with actual election outcomes. In doing so, a few key decisions must be made:
Aggregation — Aggregate polling data is used here to correct for bias in individual polls. The data used here is from FiveThirtyEight, thus it uses their weighting technique which evaluates the quality of each pollster and then weights based on their rating. For more information, see FiveThirtyEight’s weighting technique.
Regularization — Since this data only includes 11 election cycles (from 1980 to 2024) but 30 variables, there is a risk that the OLS regression model will be over fit toward our data. To correct for this, a regularized regression model will be used. This model selects for variables which are most significant in predicting the actual outcome of the election, including them in the final model.
Elastic-Net — The elastic-net regularization technique is a linear combination of Ridge and Lasso penalties. Cross-validation was used to test the optimal lambda value to minimize mean squared error in the regression and, as displayed in the graphic below, elastic-net does the best job of minimizing variance in the model.
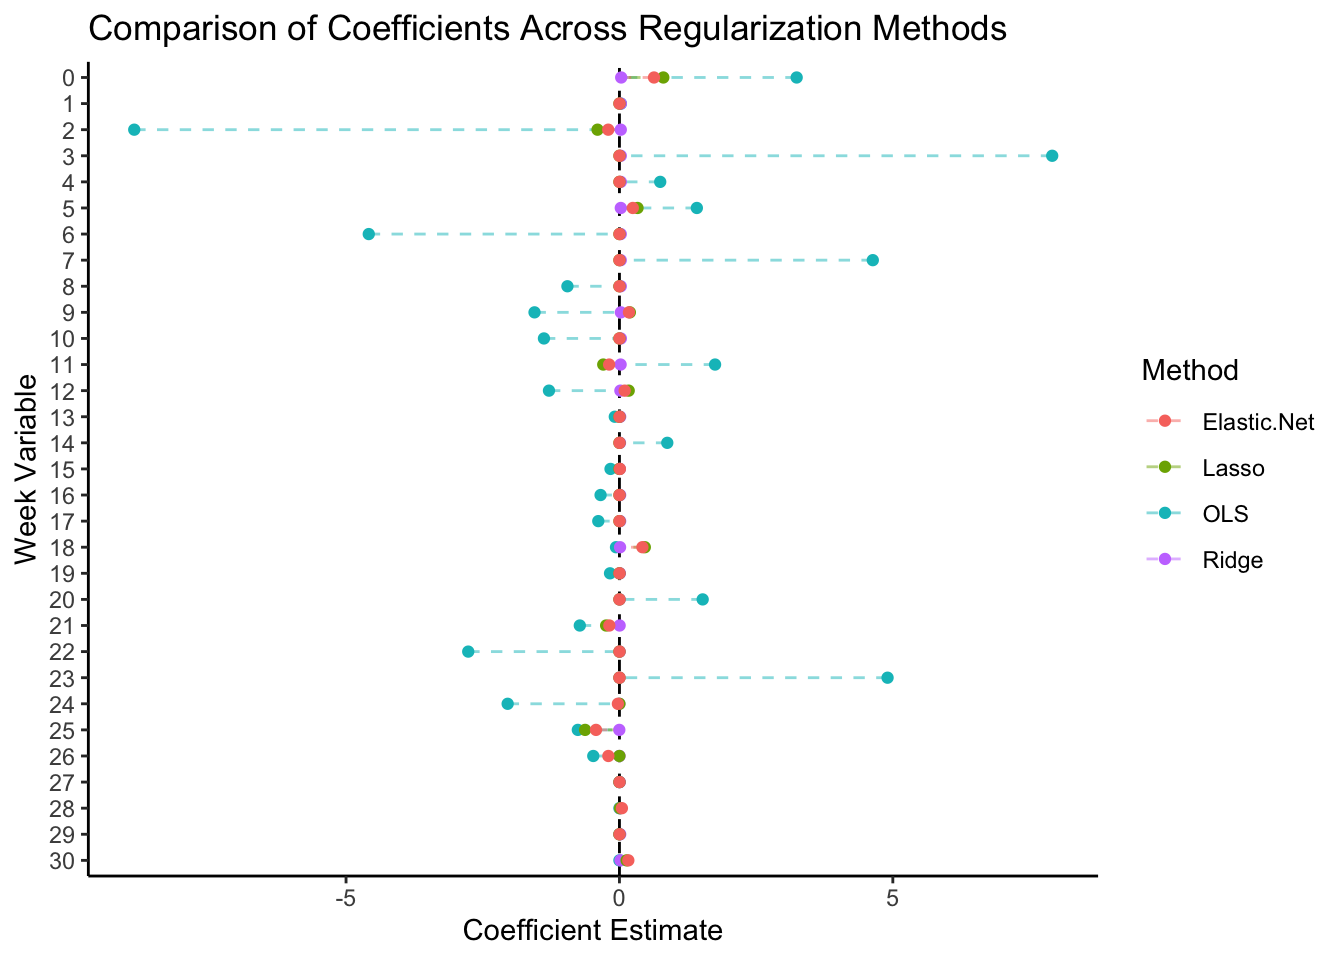
According to the Elastic-Net model, the only statistically significant predictors are weeks 0, 2, 5, 9, 11, 12, 15, 18, 21, 24, 25, 26, and 30. These coefficients cannot be interpreted because they are biased for the sake of decreasing model variance.
While it is difficult to determine exactly why the weeks listed above have more predictive power than other weeks, my intuition is that the earlier weeks are significant due to the power of fundamentals and partisan stickiness. Indeed, most individuals are loyal to a particular party and are able to determine their vote based on a few economic fundamentals well before election day. In the lead up to the election, however, the news cycle is dominated by general election coverage and information, generating two effects. First, right before election day the polls tend to converge as voters become enlightened, making later polls more accurate. Second, poll volatility is often a reflection of media volatility within a media-driven election environment, thus in the weeks before elections small moments may have large effects on polling, decreasing the reliability of this data (Gelman and King, 1993).
Using this model, how can polling predict the outcome of the 2024 election?
| Candidate | Polling Model | Fundamentals Model | Combined Model |
|---|---|---|---|
| Kamala Harris | 50.55338 | 51.23438 | 50.4831 |
| Donald Trump | 49.44662 | 47.63135 | 47.9374 |
The elastic-net regularized regression model trained above uses aggregate polling data to predict the national two-party vote share in 2024. Using polling as a predictor, the normalized model estimates a 50.55% two-party popular vote share for Vice President Harris and a 49.45% two-party popular vote share for former President Trump, giving Harris the majority.
Furthermore, using an elastic-net regularized regression of the economic fundamental model from last week including the effect of GDP growth, RDPI growth, CPI, and unemployment on incumbent vote share then allows for the creation of a combined model. This combined model, which incorporates both economic fundamentals and polling data, estimates a 50.48% two-party popular vote share for Vice President Harris and a 47.94% two-party popular vote share for former President Trump, once again giving Harris the majority.
Notes
All code above is accessible via Github.
Sources
Galton, Francis. “Vox Populi.” Nature 75, no. 1949 (1907): 450-51. https://doi.org/10.1038/075450a0.
Gelman, Andrew, and Gary King. “Why Are American Presidential Election Campaign Polls so Variable When Votes Are so Predictable?” British Journal of Political Science 23, no. 4 (1993): 409-51. https://doi.org/10.1017/s0007123400006682.
“How Our Pollster Ratings Work.” FiveThirtyEight. Last modified March 10, 2023. Accessed September 22, 2024. https://fivethirtyeight.com/methodology/how-our-pollster-ratings-work/.
Morris, G. Elliott. “How 538’s 2024 presidential election forecast works.” Abc News. Last modified June 11, 2024. Accessed September 23, 2024. https://abcnews.go.com/538/ 538s-2024-presidential-election-forecast-works/story?id=110867585.
Silver, Nate. “How FiveThirtyEight’s 2020 Presidential Forecast Works — And What’s Different Because Of COVID-19.” FiveThirtyEight. Last modified August 12, 2020. Accessed September 23, 2024. https://fivethirtyeight.com/features/ how-fivethirtyeights-2020-presidential-forecast-works-and-whats-different-because-of-covid-19/.
Data Sources
US Presidential Election Popular Vote Data from 1948-2020 provided by the course. Economic data from the U.S. Bureau of Economic Analysis, also provided by the course. Polling data sourced from FiveThirtyEight, also provided by the course.