How does the economy relate to election outcomes?
Many scholars argue that most presidential elections are determined by political and economic conditions called fundamentals, which exist outside of campaign efforts by either party. Factors like economic growth, disposable income, inflation, and the cost of living, which are often economic circumstances of the previous administration, are found to be highly correlated with election outcomes. This phenomenon is known as retrospective economic voting, wherein a voter makes choices based on the incumbent’s past performance, with a specific focus on the economy (Achen and Bartels, 2017).
To evaluate this correlation it is important to look at the relationship between economic indicators — represented here by gross domestic product growth as well as real disposable personal income growth — and two-party vote. In doing so, I will be focusing on economic data from quarter 2, the financial reporting quarter right before the election. This echoes the assumption embedded within retrospective voting that a vast majority of American voters only begin paying attention to the election in the months leading up to November, rewarding or punishing incumbent candidates and/or parties based on recent economic conditions (Achen and Bartels, 2017). Furthermore, I will use both GDP and RDPI to begin investigating the question of whether or not American voters pay attention to general economic trends, or merely the money in their wallets at the time of the election.
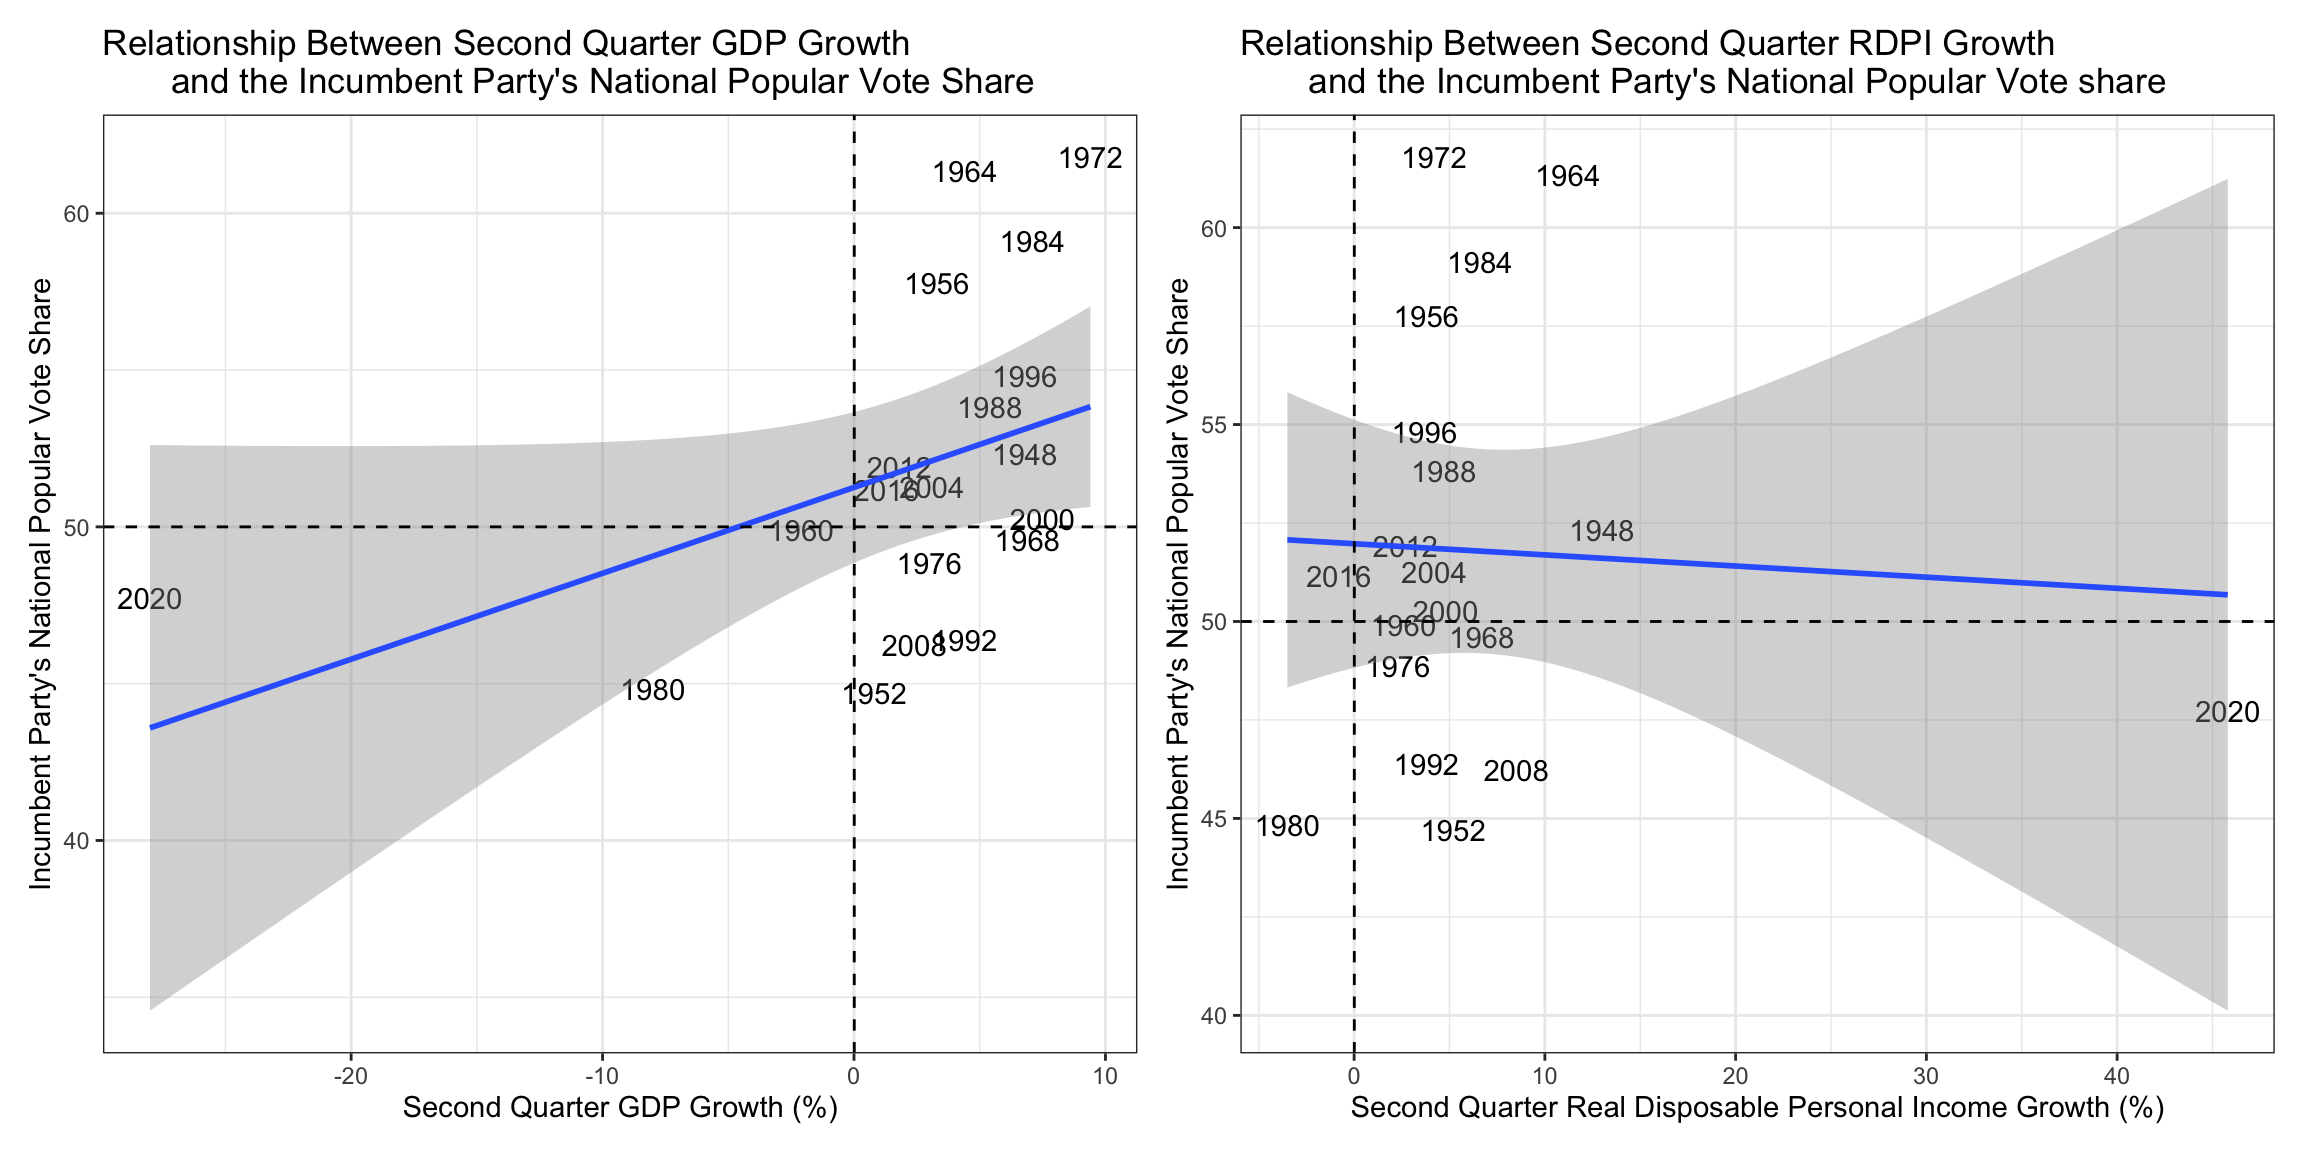
From these plots it is somewhat difficult to discern whether or not a correlation exists between the two second quarter economic indicators plotted above — GDP growth and RDPI growth — and the Incumbent Party’s national popular vote share. Indeed, the blue bivariate regression line on each plot paints a better picture of the data, yet one which is still difficult to interpret without more information. One thing that is easy to discern, however, is that for both indicators, the year 2020 is an obvious outlier in the data. Due to the unique nature of the COVID-19 pandemic and the subsequent recession it caused, in the quarter preceding the 2020 election, unemployment remained high while economic stimulus and back-to-work policies allowed for GDP growth and RDPI growth to bounce back rapidly (NPR News). Since this moment was so unique and its data so different than any other election year, 2020 will be excluded in further analysis and prediction.
The table below better outlines the bivariate regression relationship between the economic indicators plotted above and the national popular vote of the incumbent party from 1948 to 2016.
Bivariate Regression Models
| Variable (Measured in Q2) | Coefficient | R-squared | Significant at 20% | Significant at 5% |
|---|---|---|---|---|
| GDP Growth | 0.7365757 | 0.3248066 | Yes | Yes |
| RDPI Growth | 0.4604327 | 0.1114869 | Yes | No |
In analyzing the differences between these three relationships, it is first important to understand the statistical significance. The only variable significant at the 5% level is GDP growth, indicating that GDP growth is a significant predictor of election outcomes. The growth in real disposable personal income is also a significant predictor, but only at the 20% level, leaving a high likelihood of type-1 error. Furthermore, based on the R^2 values, while GDP growth in Q2 can explain around 32% of the trend in incumbent party vote share, RDPI growth can only explain 11%. This point is especially interesting when attempting to better understand the rationality of American voters. Indeed, an area for further investigation should be whether the difference in explanatory capabilities is due to differences in how american experience changes in general GDP vs. their disposable income. Finally, the coefficients of both variables, which indicate the effect of a one percent increase in growth on incumbent vote share, show that while GDP growth of 1% increases incumbent vote share by 0.74 percentage points, RDPI growth only has a 0.46 percentage point effect.
How should these models be evaluated for accuracy?
These regression models are not always accurate predictors as they can only explain a small amount of variance in the data. To test the efficacy of both models, both in-sample and out-of-sample models should be used.
Using in-sample fit to test predictive power:
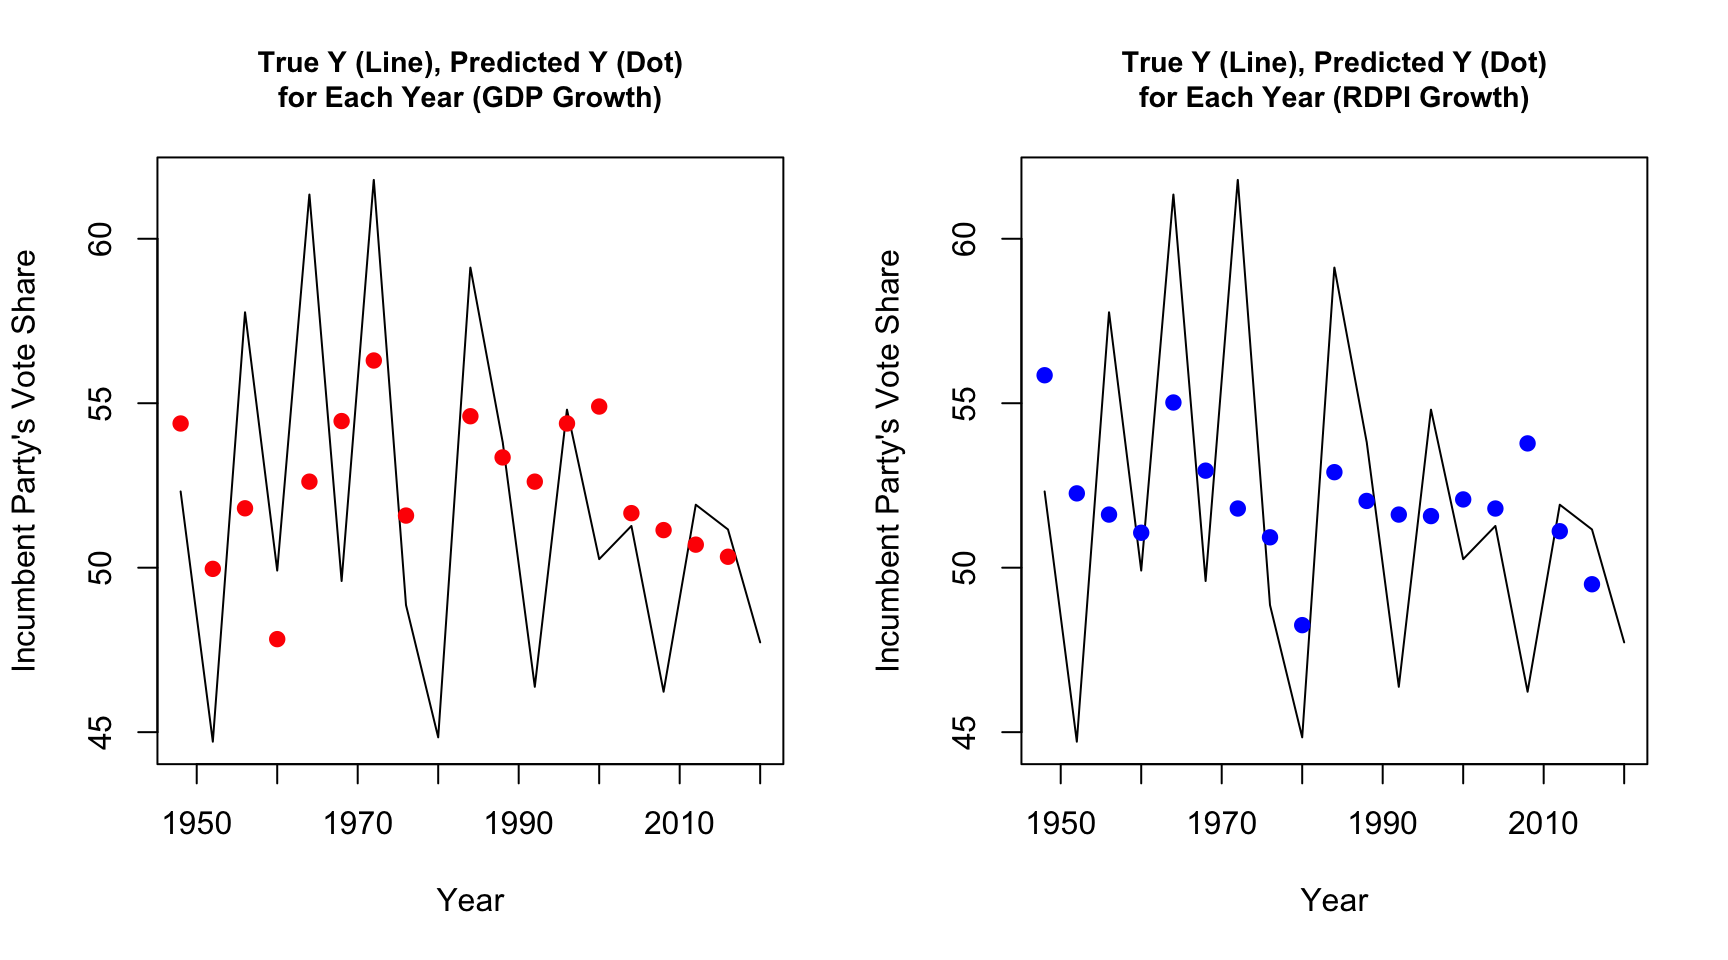
The graphics above display the true incumbent vote share (line) as well as the prediction generated by the model (points) using both GDP and RDPI as predictors. As the graphic makes apparent, the model is rarely able to closely predict the actual vote share; however, it often accurately predicts whether or not the popular vote will lean toward the incumbent. This test is only able to tell part of the story in terms of the model’s accuracy, thus it is important to also use out-of-sample testing methods.
The cross-validation method uses a random half of the existing data to train a model which then predicts for another half. By running this test multiple times, it is possible to discern an average estimate of the overall predictive power of both models.
Using cross validation to test predictive power:
| Variable (Measured in Q2) | Mean Error | Standard Deviation of Error |
|---|---|---|
| GDP Growth | -0.1613033 | 5.006764 |
| RDPI Growth | 0.1295863 | 5.798034 |
As displayed by the table above, the cross-validation test displays that the magnitude of the error generated by using GDP Growth and RDPI growth models to predict incumbent vote share are quite small. Though GDP growth tends to lead to under prediction and RDPI growth to over prediction, both are by less than one percentage point. The standard deviations indicated above do, however, indicate high variability in these results, which is important in interpreting the importance of these predictive models below.
Using these models, how can the economy be used to predict the outcome of the 2024 election?
Using the model which has been evaluated at length above to be somewhat effective in determining popular vote as well as 2024 Q2 economic data on GDP and RDPI growth, it is possible to generate a prediction for the 2024 incumbent vote share. The results of this model are displayed below.
2024 Election Prediction Model
| Variable | Predicted Value | Lower Bound (80% PI) | Upper Bound (80% PI) |
|---|---|---|---|
| GDP Growth | 51.58486 | 45.45250 | 57.71722 |
| RDPI Growth | 50.32576 | 43.11837 | 57.53316 |
Using GDP growth as a predictor, the above model estimates a 51.58% two-party popular vote share for Vice President Harris. To make this prediction, a prediction interval of 80% was used (as is common for election prediction models). Using this interval means that there is a 20% chance the real election outcome does not fall within the upper and lower bounds noted above. Using RDPI growth as a predictor, the model estimates a 50.33% two-party popular vote share for Vice President Harris, once again giving her the majority. The same prediction interval of 80% once again means that there is only an 80% likelihood the real value lies within the 43% to 57% range shown above. These results are incredibly similar, most likely indicating a strong correlation between GDP growth and RDPI growth, though definitely an interesting area for further exploration.
Notes
All code above is accessible via Github.
Sources
Achen, Christopher H., and Larry M. Bartels. Democracy for Realists : Why Elections Do Not Produce Responsive Government. Princeton, NJ: Princeton University Press, 2017. Hollis.
Kurtzleben, Danielle. “The Economy May Be Losing Its Impact On Presidential Elections.” NPR. Accessed September 15, 2024. https://www.npr.org/2020/07/09/889080504/ the-economy-may-be-losing-its-impact-on-presidential-elections.
Data Source
US Presidential Election Popular Vote Data from 1948-2020 provided by the course. Economic data from the U.S. Bureau of Economic Analysis, also provided by the course.