How competitive are presidential elections in the United States?
In order to predict the outcome of the 2024 presidential election, it is important to base the prediction model on an understanding of past elections at the national level.
Generally speaking, national elections have been competitive between the two major parties since the election of President Franklin Roosevelt in 1948. In the succeeding 75+ years, neither party has been able to maintain a significant monopoly over the Presidency.
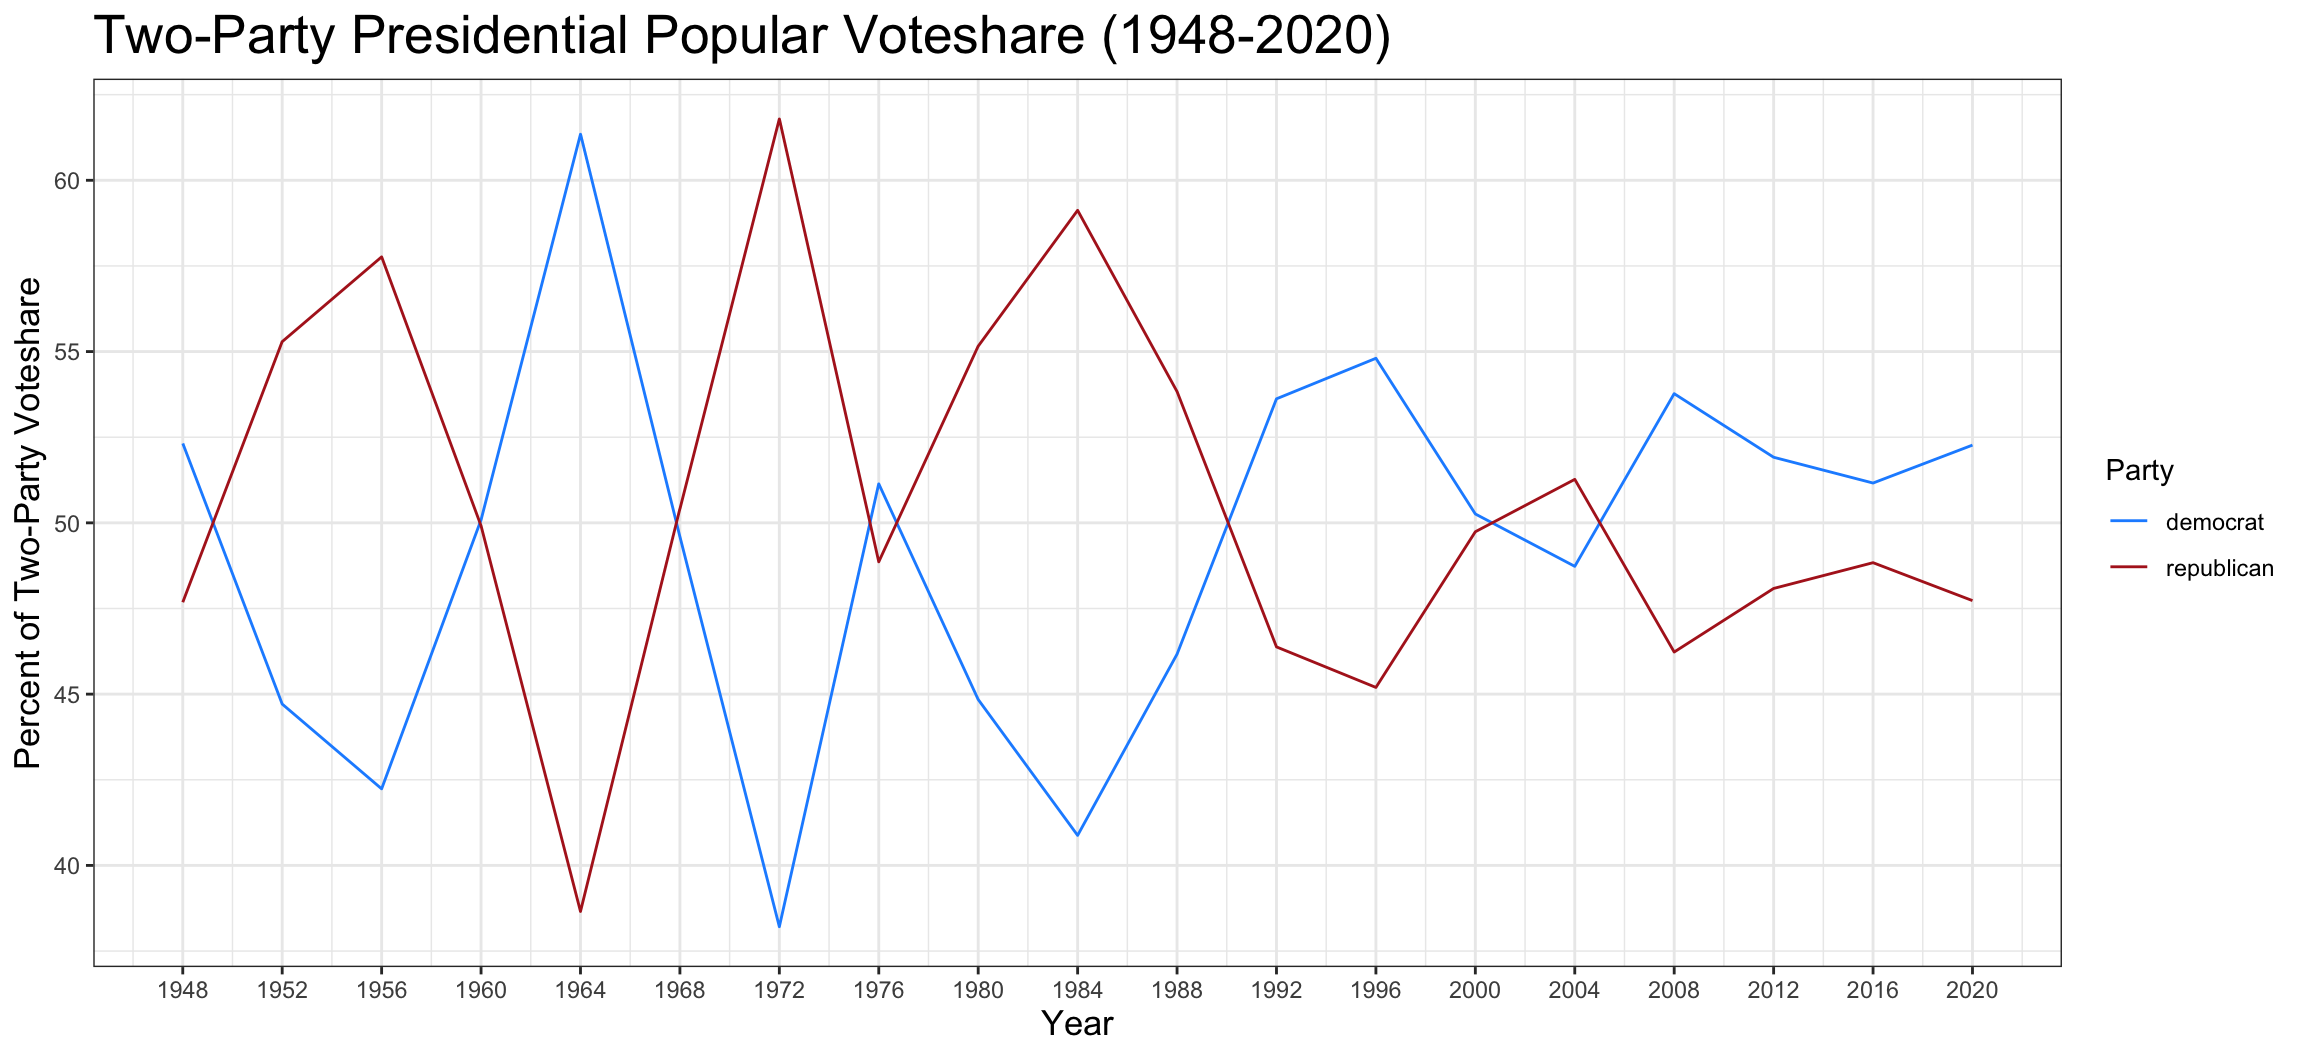
Within this time frame, the margin of victory for a winning candidate has lessened significantly. From the 1956 re-election of President Eisenhower to the 1984 re-election of President Reagan, the winning candidate received an average of 55.85% of the two-party popular vote share. Since 1988, however, the winning candidate has only recieved on average 52.23% of the two-party popular voteshare.
To better understand the factors which contribute to the competitiveness of a presidential election, it is important to analyze the narratives of both the landslide victories and narrow margins of the past 75+ years.
The 1972 Nixon v. McGovern election with a margin of 23.58%. Nixon received nearly 18 million more votes than his democratic challenger due to a combination of factors. Not only was he able to capitalize off of a strong economy and immense popularity, but his Vietnam policy allowed him to successfully frame McGovern as a left-wing extremist.Politico
The 1964 Johnson v. Goldwater election with a margin of 22.69%. In the wake of the assassination of JFK, Johnson used his position as Kennedy’s Vice President to carry forward JFK’s legacy. Invoking Kennedy’s memory, Johnson helped calm hysteria and push forth the Civil Rights Act. Johnson beat Goldwater by a margin of over 15 million votes. Britannica
The 1960 JFK v. Nixon election with a margin of 0.17%. In the narrowest election in US History, Kennedy and Nixon fought closely on issues of the Cold War and Civil Rights. Strategic use of his Catholic faith and a key endorsement by MLK Sr. led to his victory in important battleground states. JFK Library
The 2000 Bush v. Gore election with a margin of 0.52%. Decided by a few hundred votes in Florida, this election was so close it was essentially decided by the U.S. Supreme Court. Clinton’s scandals gave Gore a difficult challenge to re-frame the character of the Democratic Party, yet the state of economy put Gore at a significant advantage. Political Science Quarterly
These elections indicate there are many narratives which contribute to the competitiveness of an election. Indeed, one of the most influential factors in determining election competitiveness is past precedent, which will be explored as a predictor in depth below.
Which states vote blue/red and how consistently?
In presidential elections, it is not popular vote which determines election outcomes, but the electoral college. In this winner-takes-all system, a state’s population dictates the number of electors allocated to that state. For the most part, the popular vote winner in that state will receive all of that state’s electors, thus increasing the importance of understanding voting patterns on a state-by-state basis.
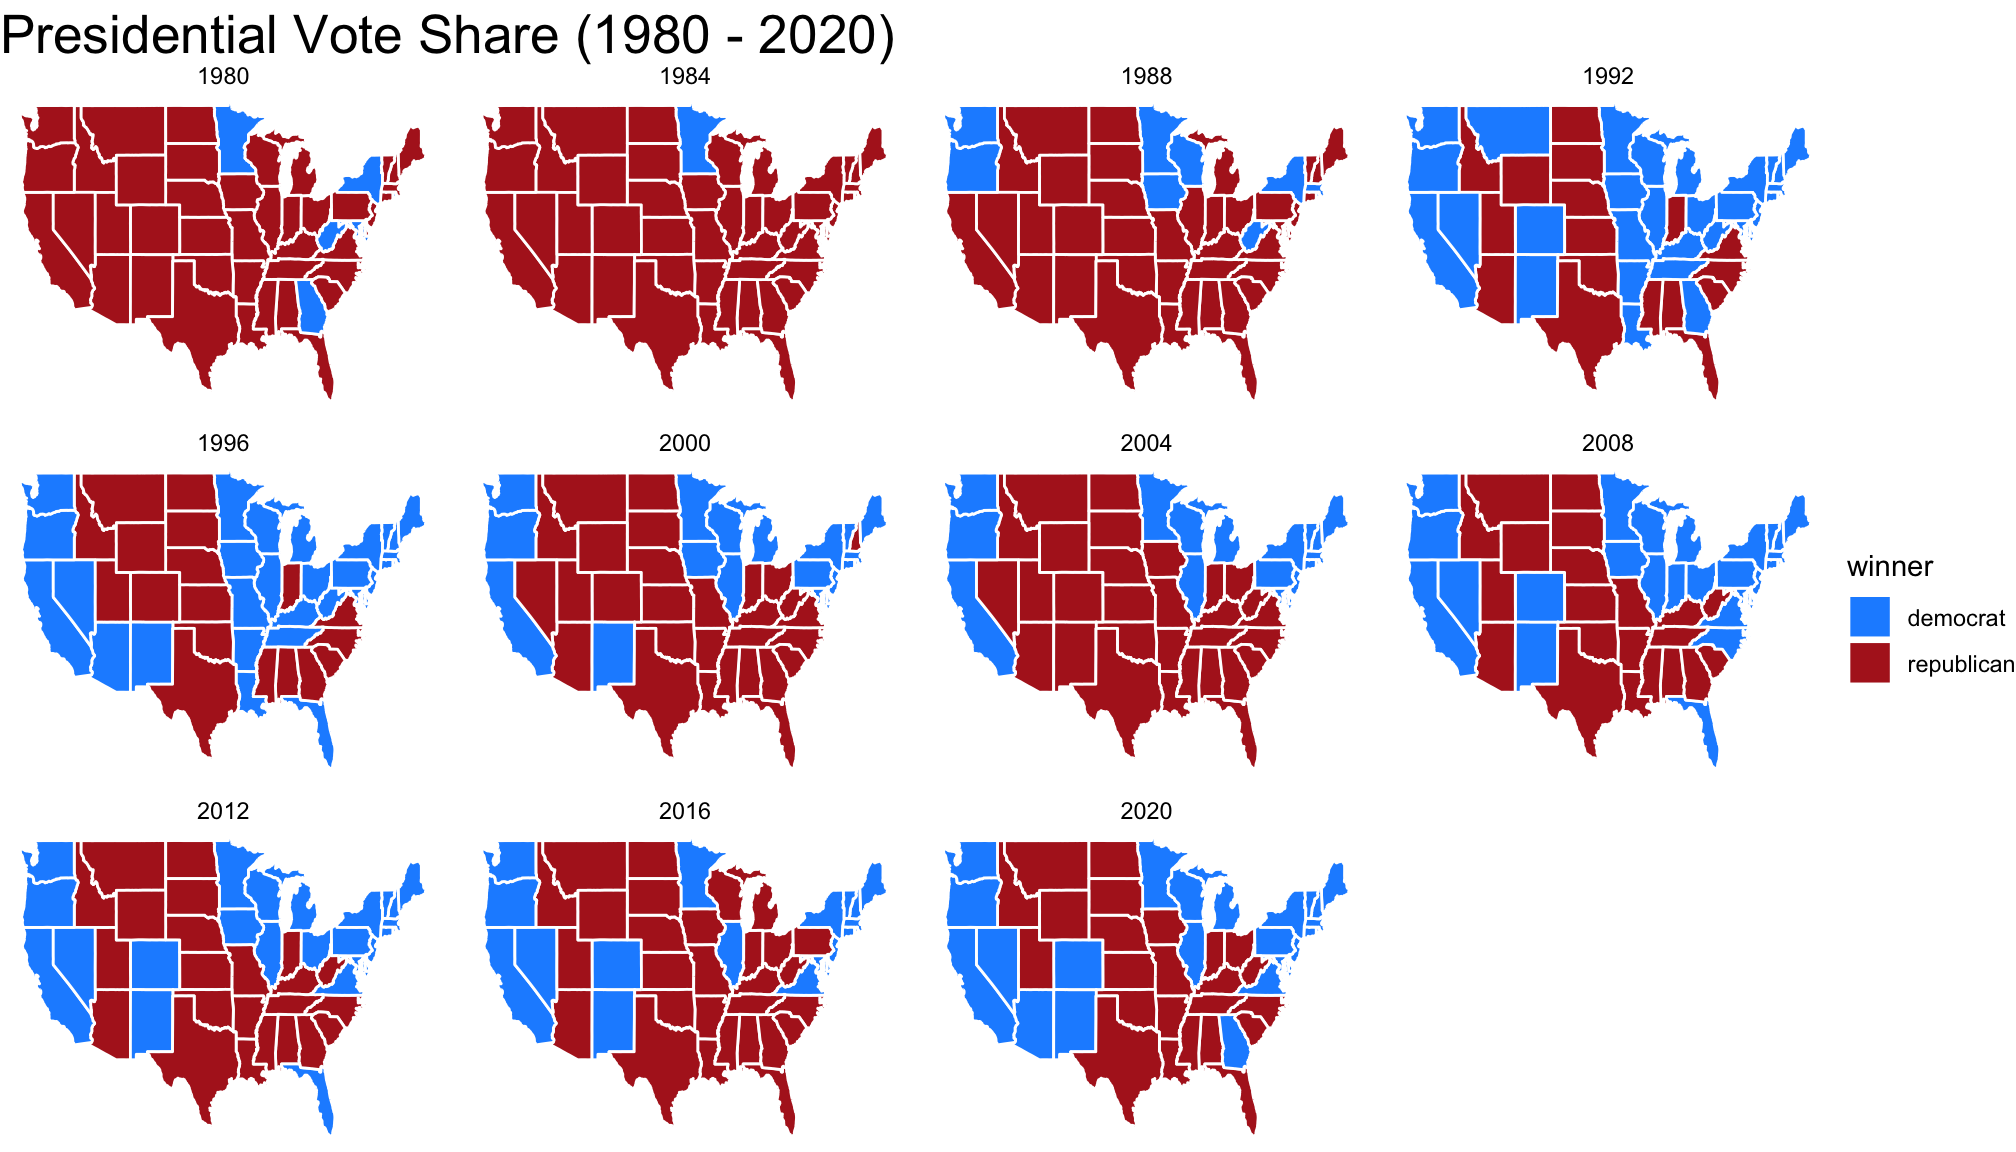
As displayed by the graphics above, states like Arizona, Georgia, Michigan, Nevada, North Carolina, Pennsylvania, and Wisconsin (93 EV) lack the party consistency of other states. In this way, candidates often focus their campaigning on winning these so-called swing states.
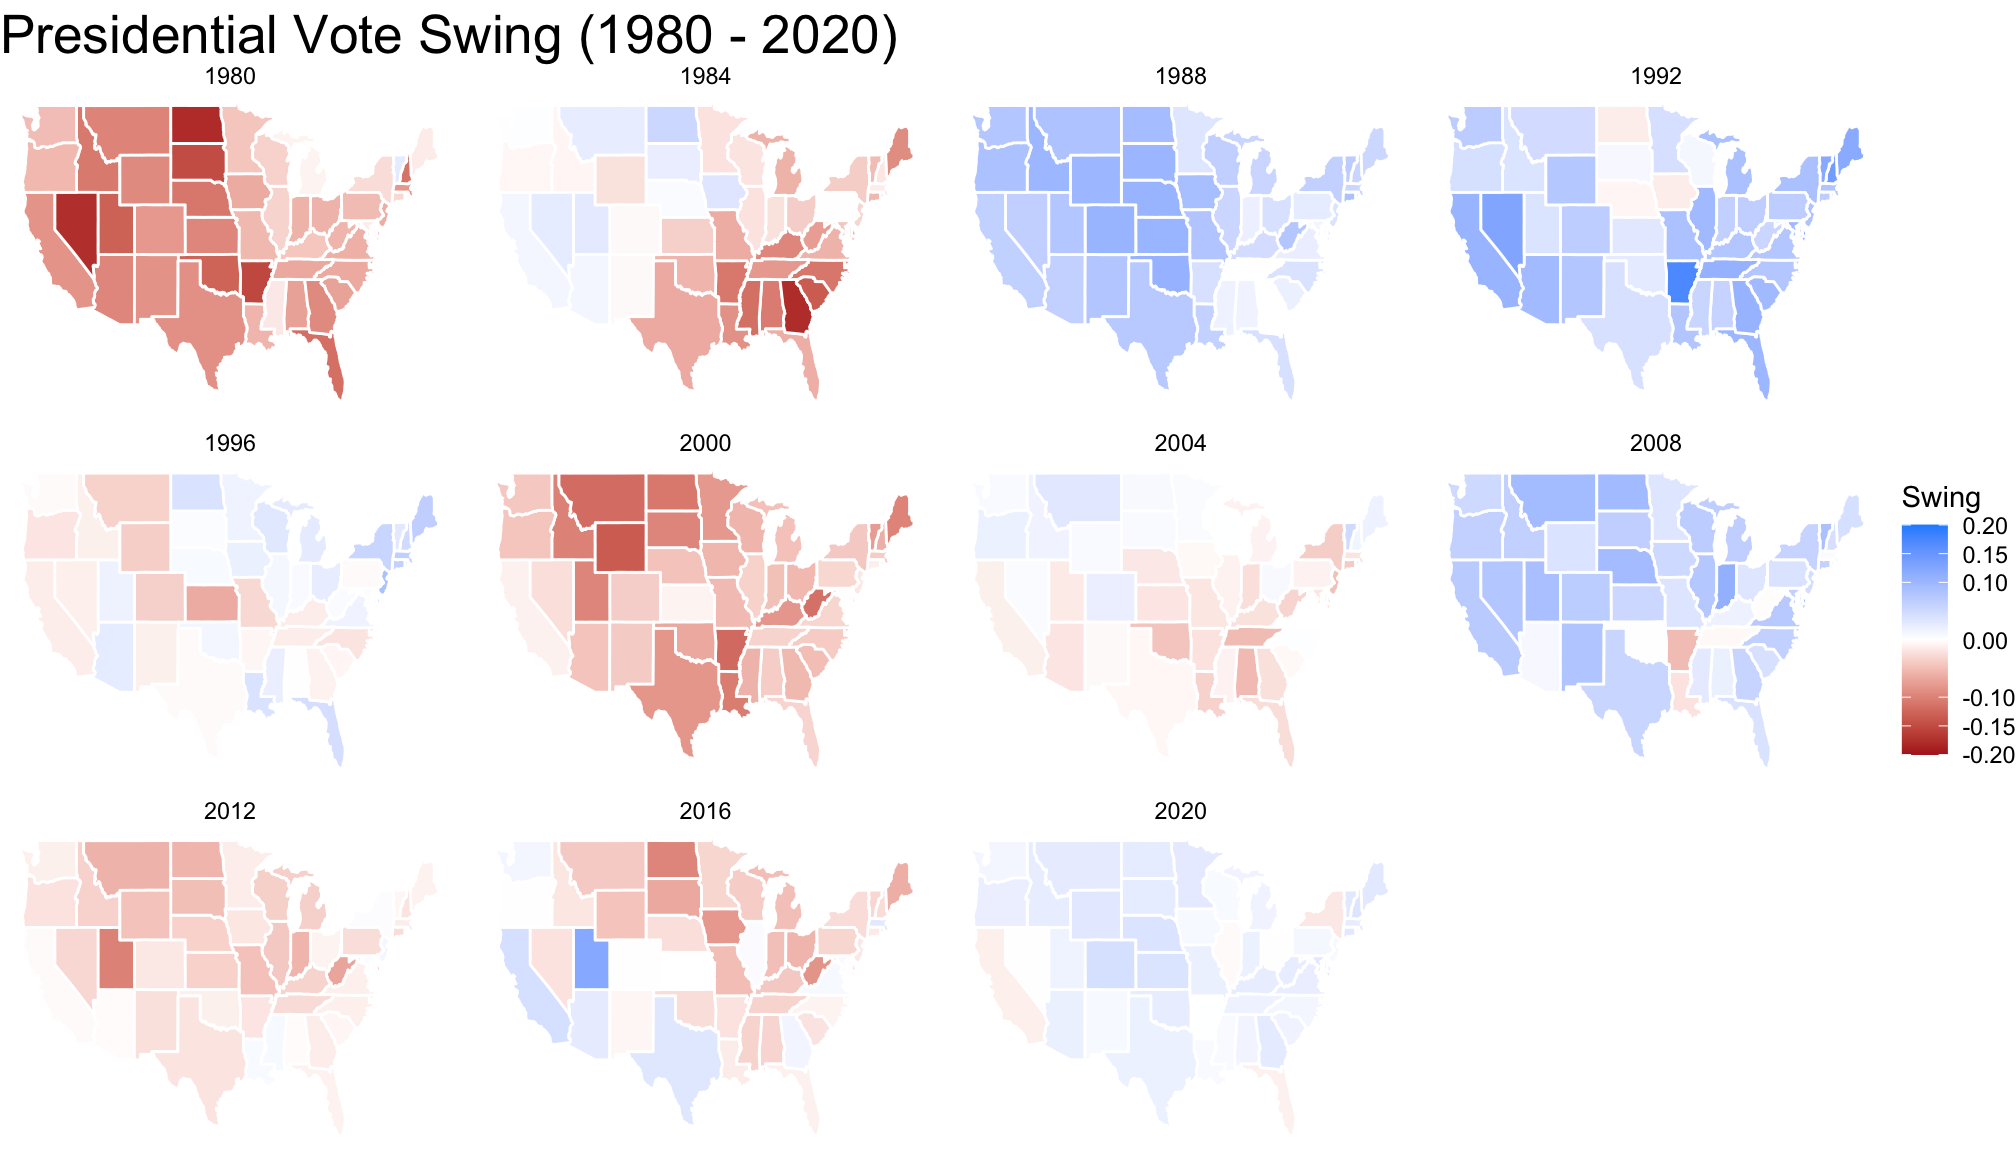
The second graphic illustrates the proportion of the two-party vote share allocated to the democratic party relative to the previous year, or, in other words, the state’s swing. A state which is a darker shade of blue swung more democratic than the previous year, while a state which is a darker shade of red swung more republican. This map similarly illustrates the extreme volatility of battleground states relative to other states across the country.
Furthermore, these battleground states have shifted over time. Per the graphic, states like Ohio and Florida which were significant swing states from 1980 to 2008 have recently been replaced by Arizona and Georgia, previous republican strongholds which went democrat in 2020.
How can electoral competitiveness be used to predict the outcome of the 2024 election?
As concluded by the first figure, the competitiveness of each election cycle is often influenced by past elections. Yet, as noted by the second figure, it is important to look at these trends on a state-by-state basis as it is the electoral college, not the general popular vote, which determines election outcomes. Furthermore, many states vote consistently toward a singular party, thus precedence plays a large role in determining election outcomes.
The Helmut Norpoth Primary Model uses a weighted average of the two-party vote share from the previous two election cycles to predict the outcome of a future election. To make my prediction, I will be using a simplified version of this model as outlined below.
\[ Y_{2024_i} = 0.75 \times Y_{2020\_voteshare_i} + 0.25 \times Y_{2016\_voteshare_i} \]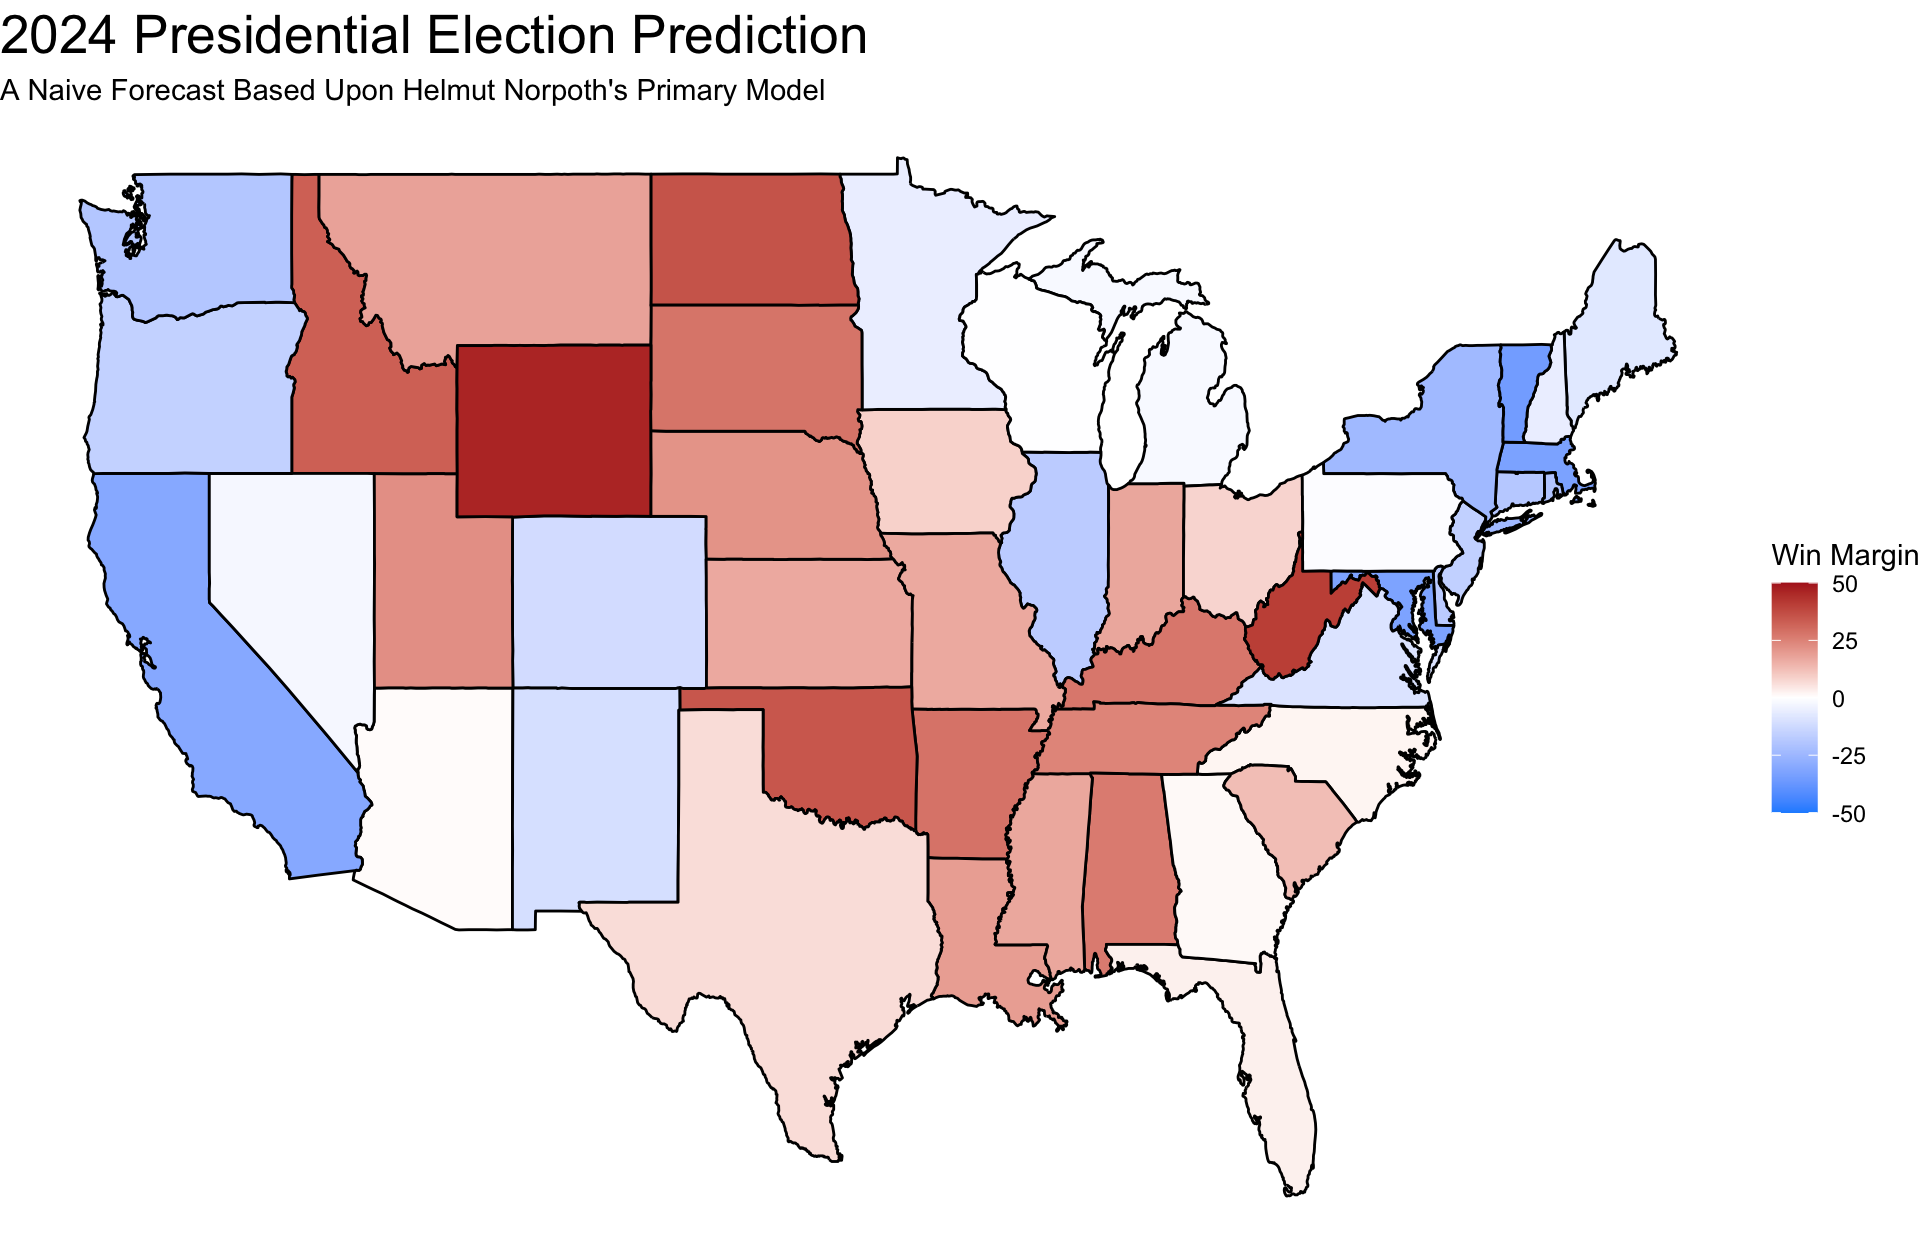
Based upon this naive prediction model, Harris is expected to win the key battle ground states of Michigan (+2.06%), Nevada, Pennsylvania (+0.7%), and Wisconsin (+0.27%) while Trump will capture Arizona (+0.7%), Georgia (+1.15%), and North Carolina (+1.98%). This would lead to a Harris victory with 276 electoral votes over Trump’s 262 votes.
Notes
All code above is accessible via Github.
Sources
Glass, Andrew. “Nixon reelected in landslide, Nov. 7, 1972.” Politico. Accessed September 8, 2024. https://www.politico.com/story/2018/11/07/this-day-in-politics-november-7-963516.
Levy, Michael. “United States Presidential Election of 1964.” In Encyclopedia Britannica. Last modified August 9, 2024. https://www.britannica.com/event/United-States-presidential-election-of-1964.
National Archives. “Campaign of 1960.” John F. Kennedy Presidential Library and Museum. Accessed September 8, 2024. https://www.jfklibrary.org/learn/about-jfk/jfk-in-history/campaign-of-1960.
Norpoth, Helmut. “The Primary Model.” The Primary Model. Accessed September 8, 2024. http://primarymodel.com/.
Pomber, Gerald M. “The 2000 Presidential Election: Why Gore Lost.” Political Science Quarterly 116, no. 2 (2001): 201. Accessed September 8, 2024. https://www.uvm.edu/~dguber/POLS125/articles/pomper.htm.
Data Source
US Presidential Election Popular Vote Data from 1948-2020 provided by the course.